Monitoring Quickstart
Observability Plus includes Observability Query for monitoring your project.
- Make sure you upgrade to Pro or Enterprise plan.
- Pro and Enterprise teams should Upgrade to Observability Plus to access Monitoring.
In the following guide you will learn how to view the most requested posts on your website.
- Navigate to the Monitoring tab from your Vercel dashboard
- Click the Create New Query button to open the query builder
- Click the Edit Query button to configure your query with clauses
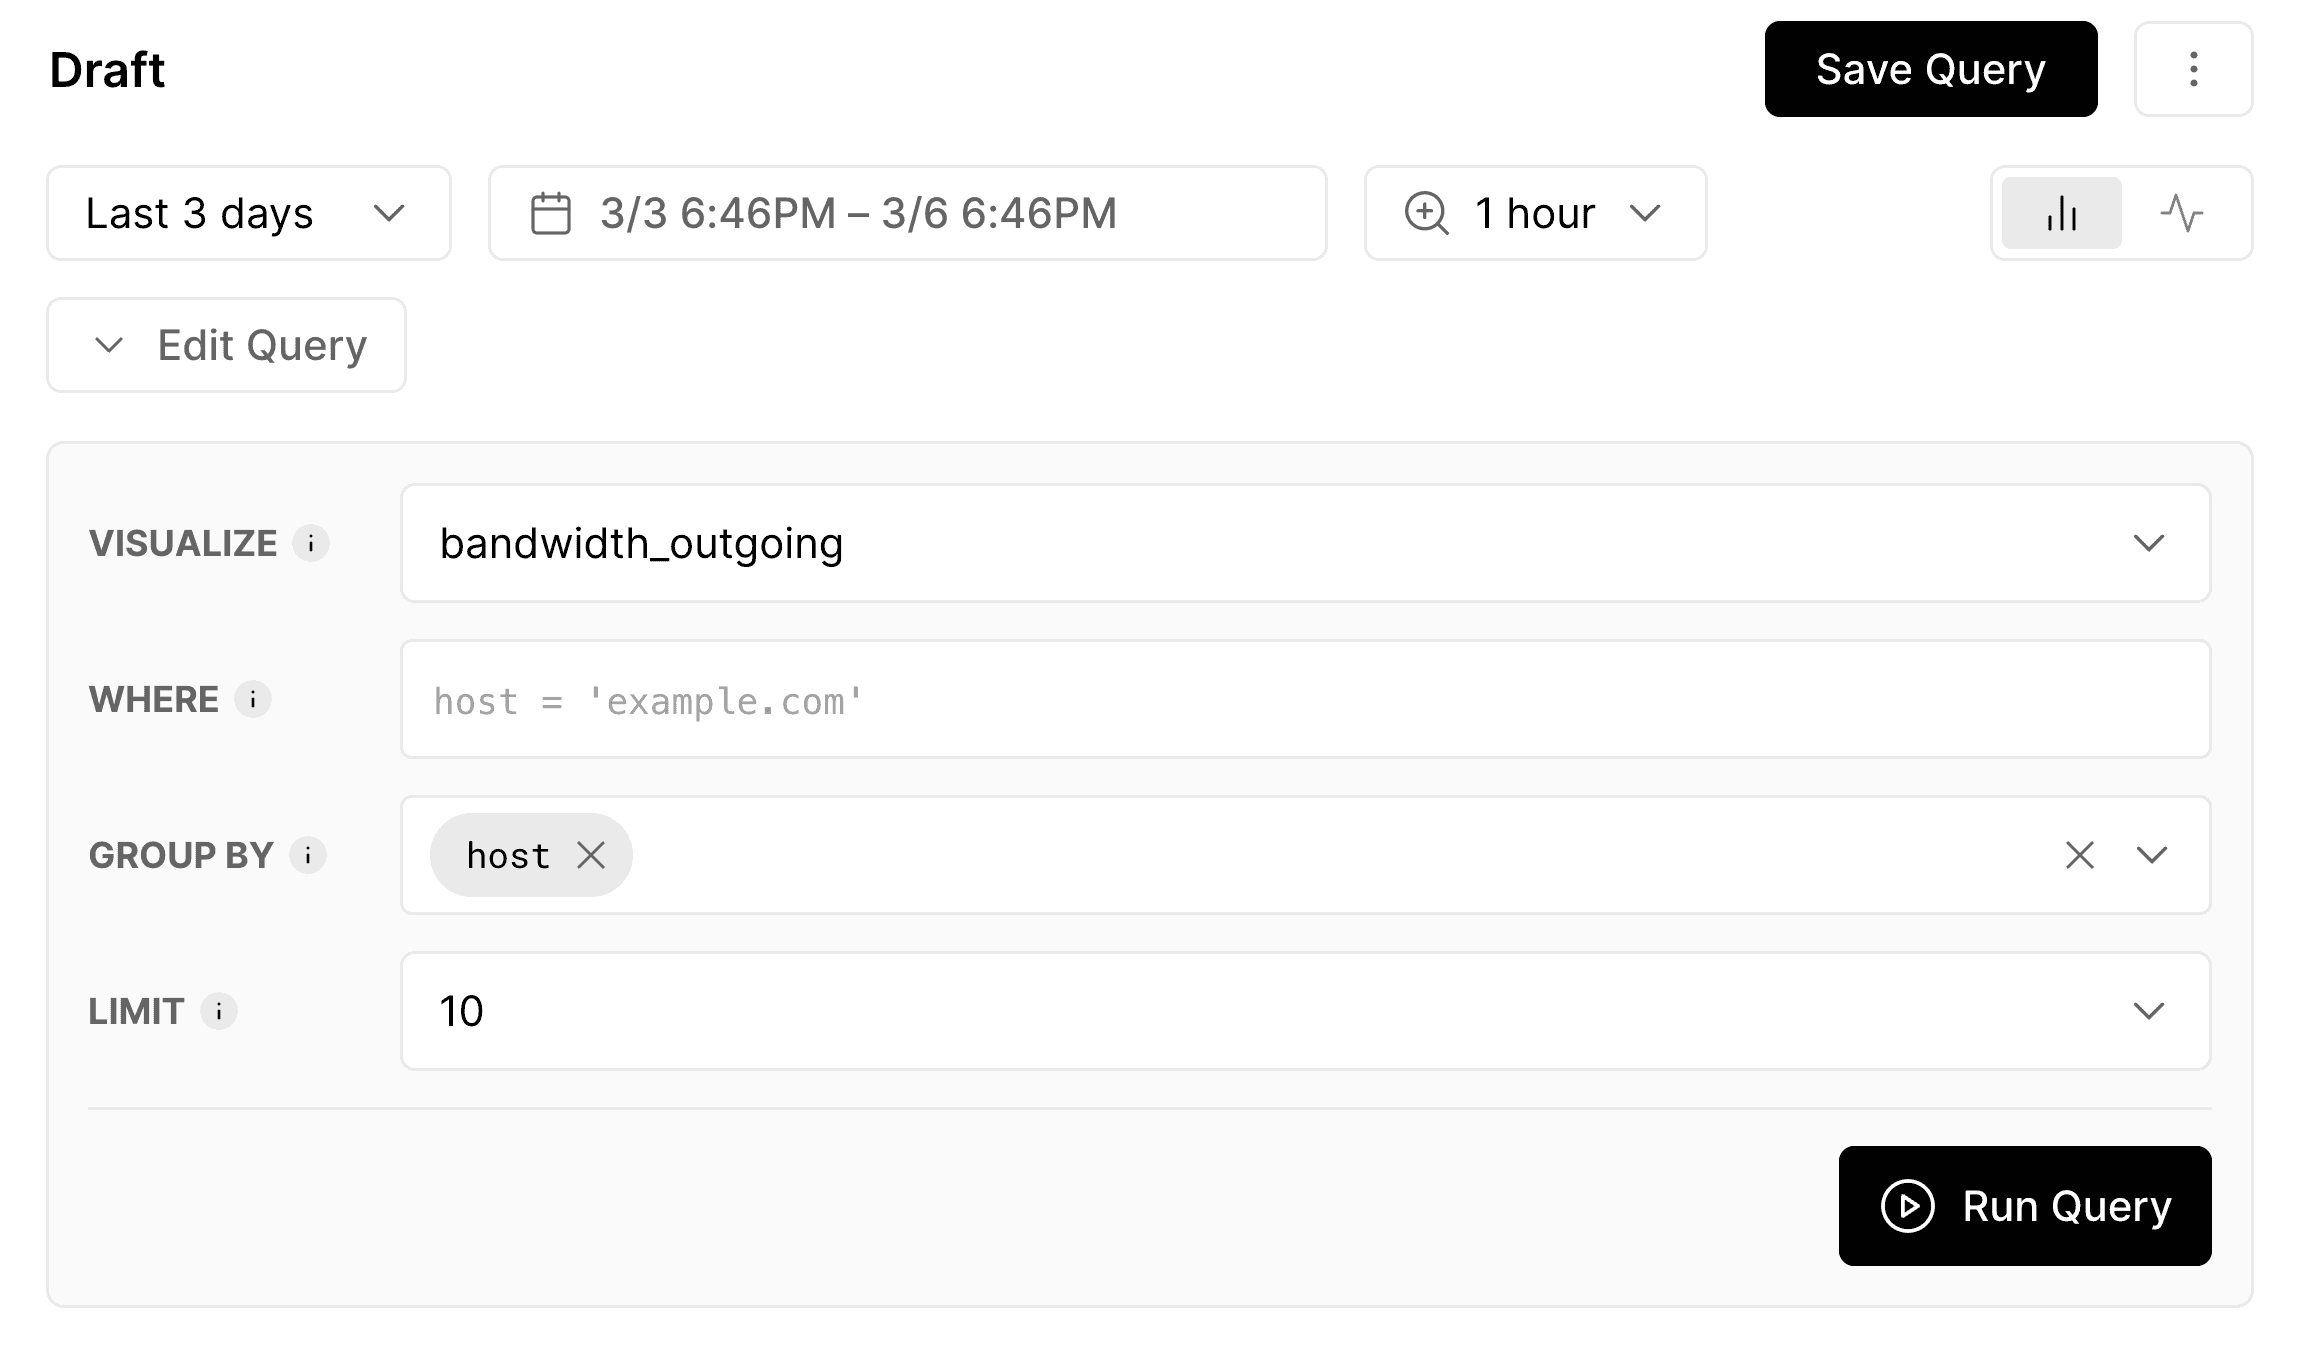
Add clauses through query editor. The Visualize clause specifies which field in your query will be calculated. Set the Visualize clause to
requeststo monitor the most popular posts on your website.Click the Run Query button, and the Monitoring chart will display the total number of requests made.
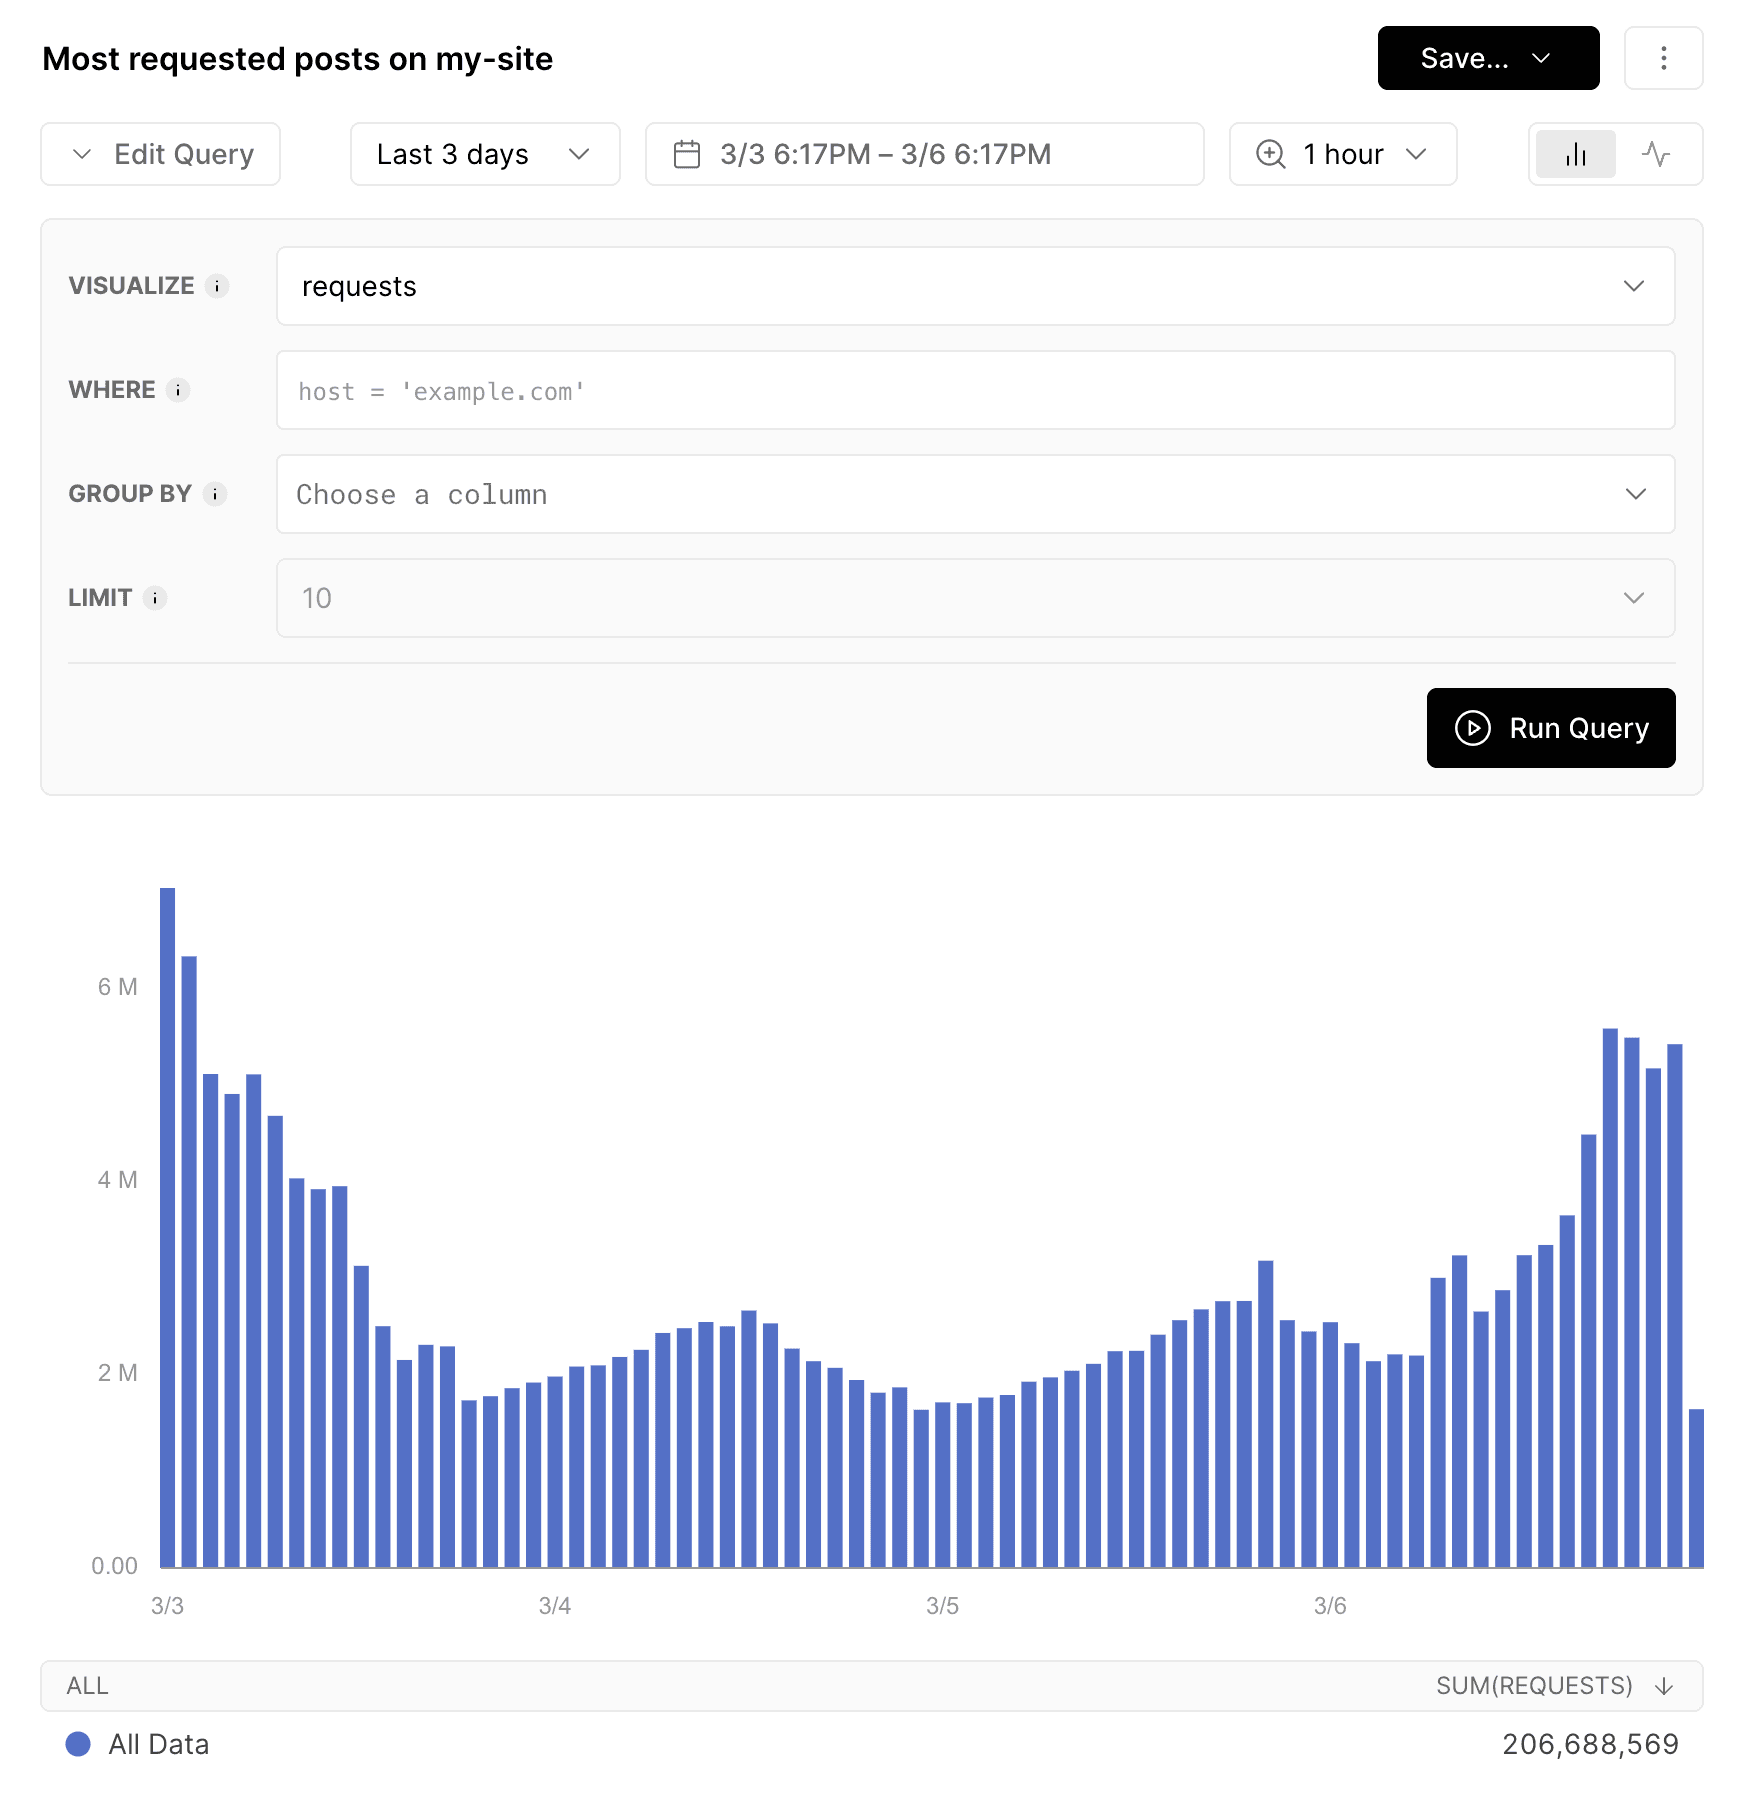
Configure Visualize clause to fetch requests. To filter the query data, use the Where clause and specify the conditions you want to match against. You can use a combination of variables and operators to fetch the most requested posts. Add the following query statement to the Where clause:
host = 'my-site.com' and like(request_path, '/posts%')This query retrieves data with a host field of
my-site.comand arequest_pathfield that starts with /posts.The
%character can be used as a wildcard to match any sequence of characters after/posts, allowing you to capture allrequest_pathvalues that start with that substring.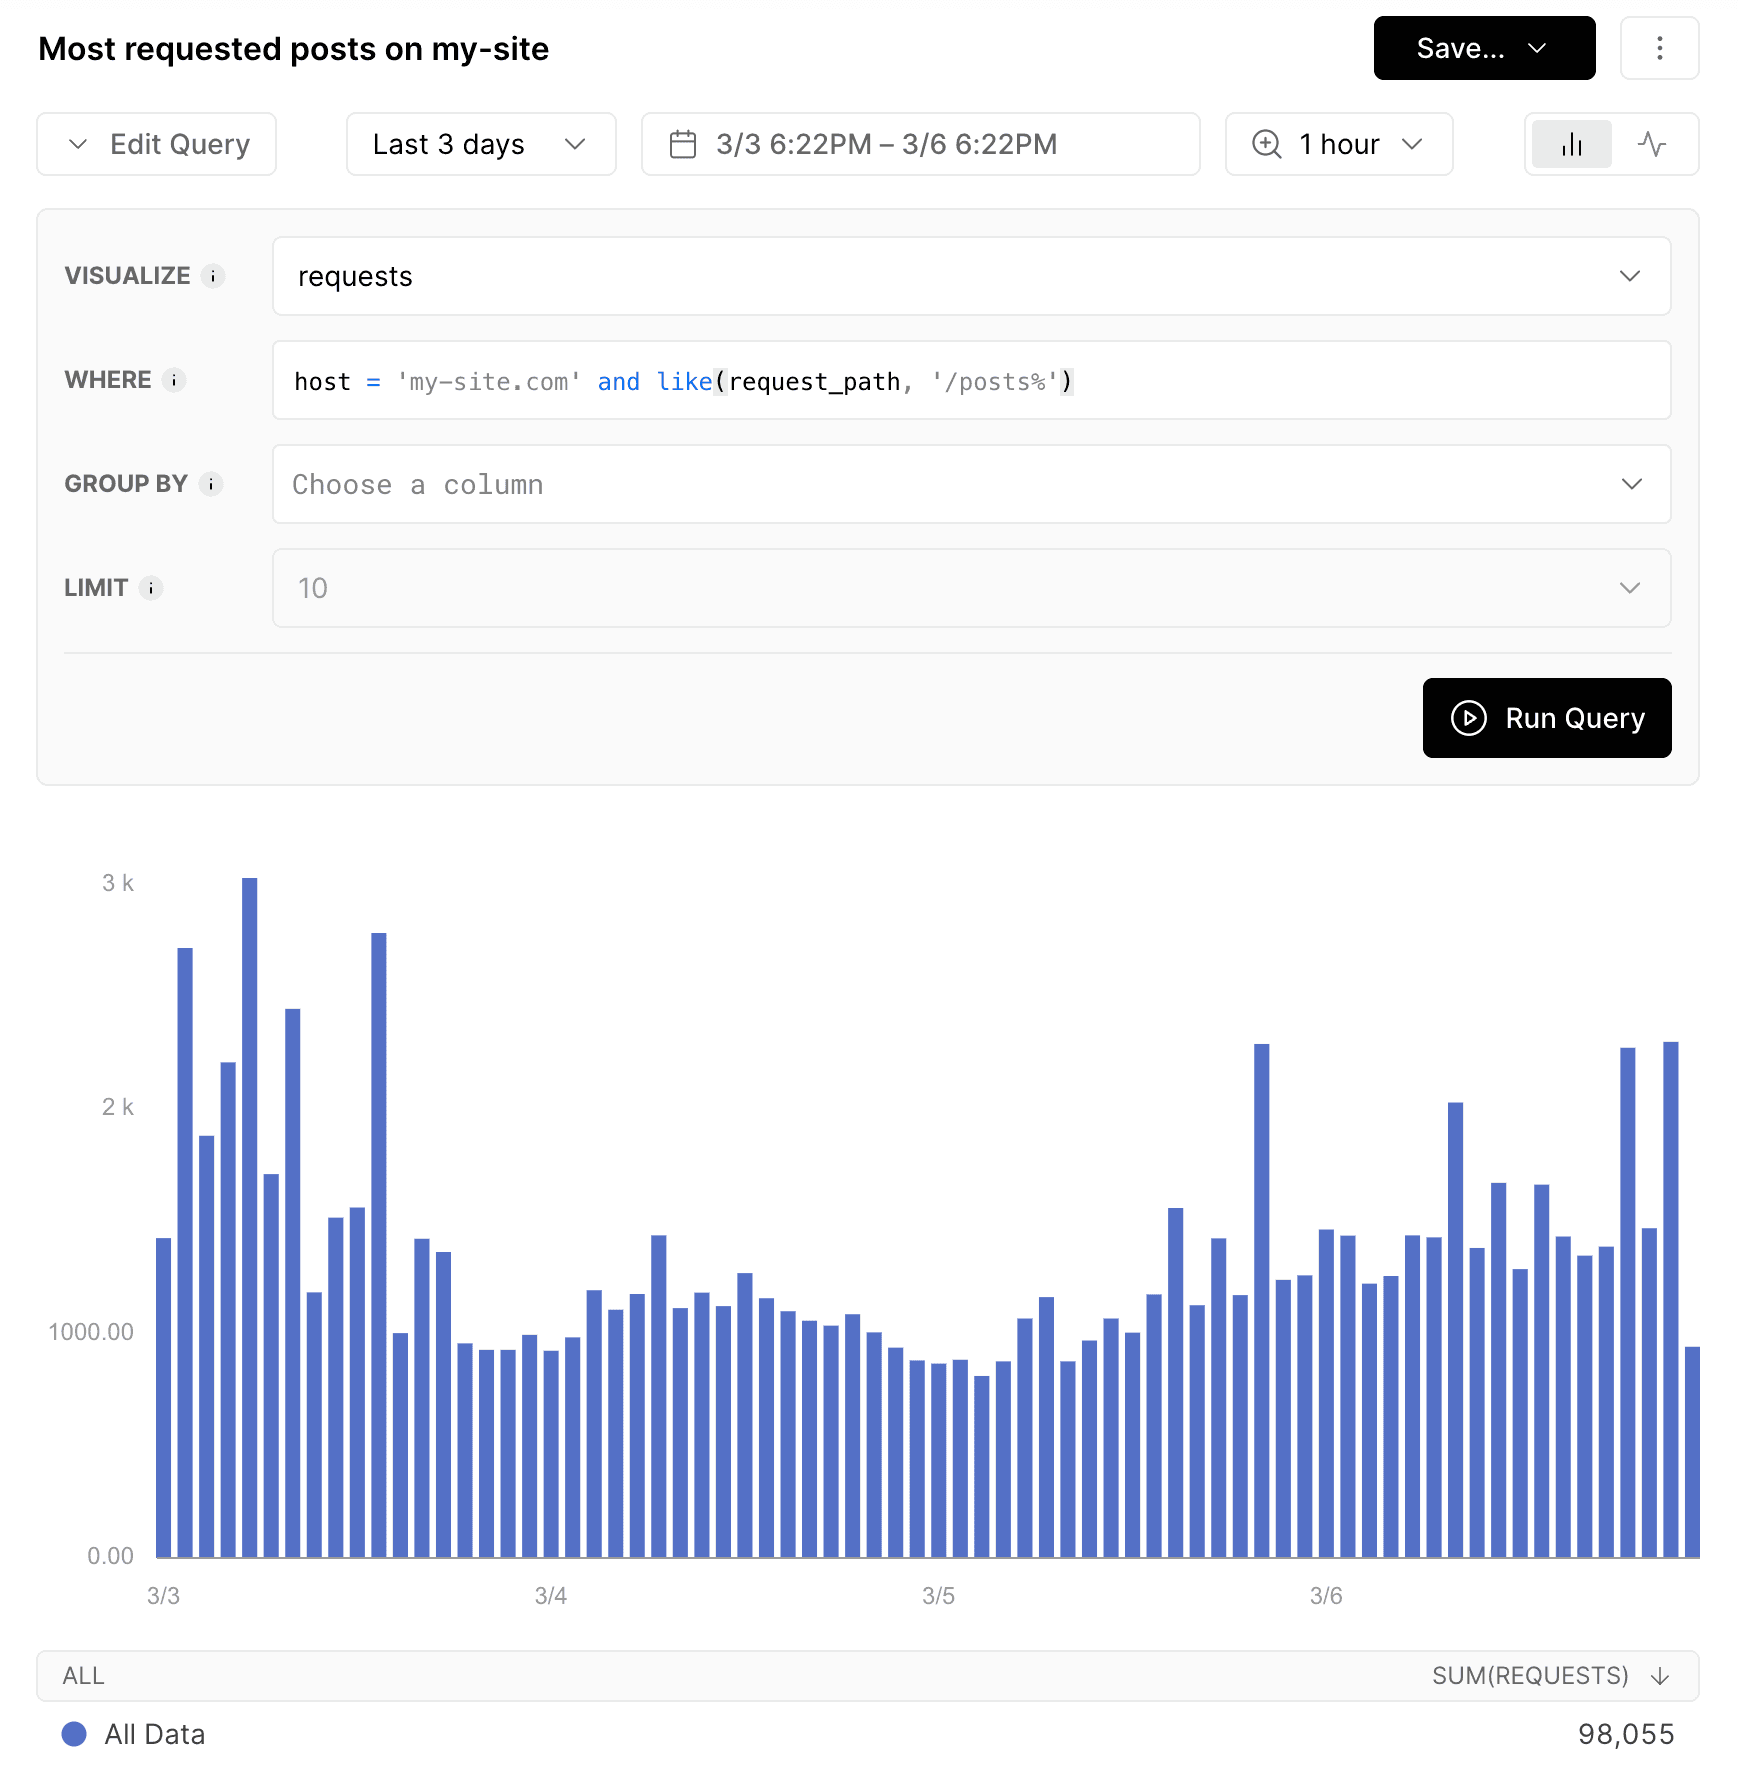
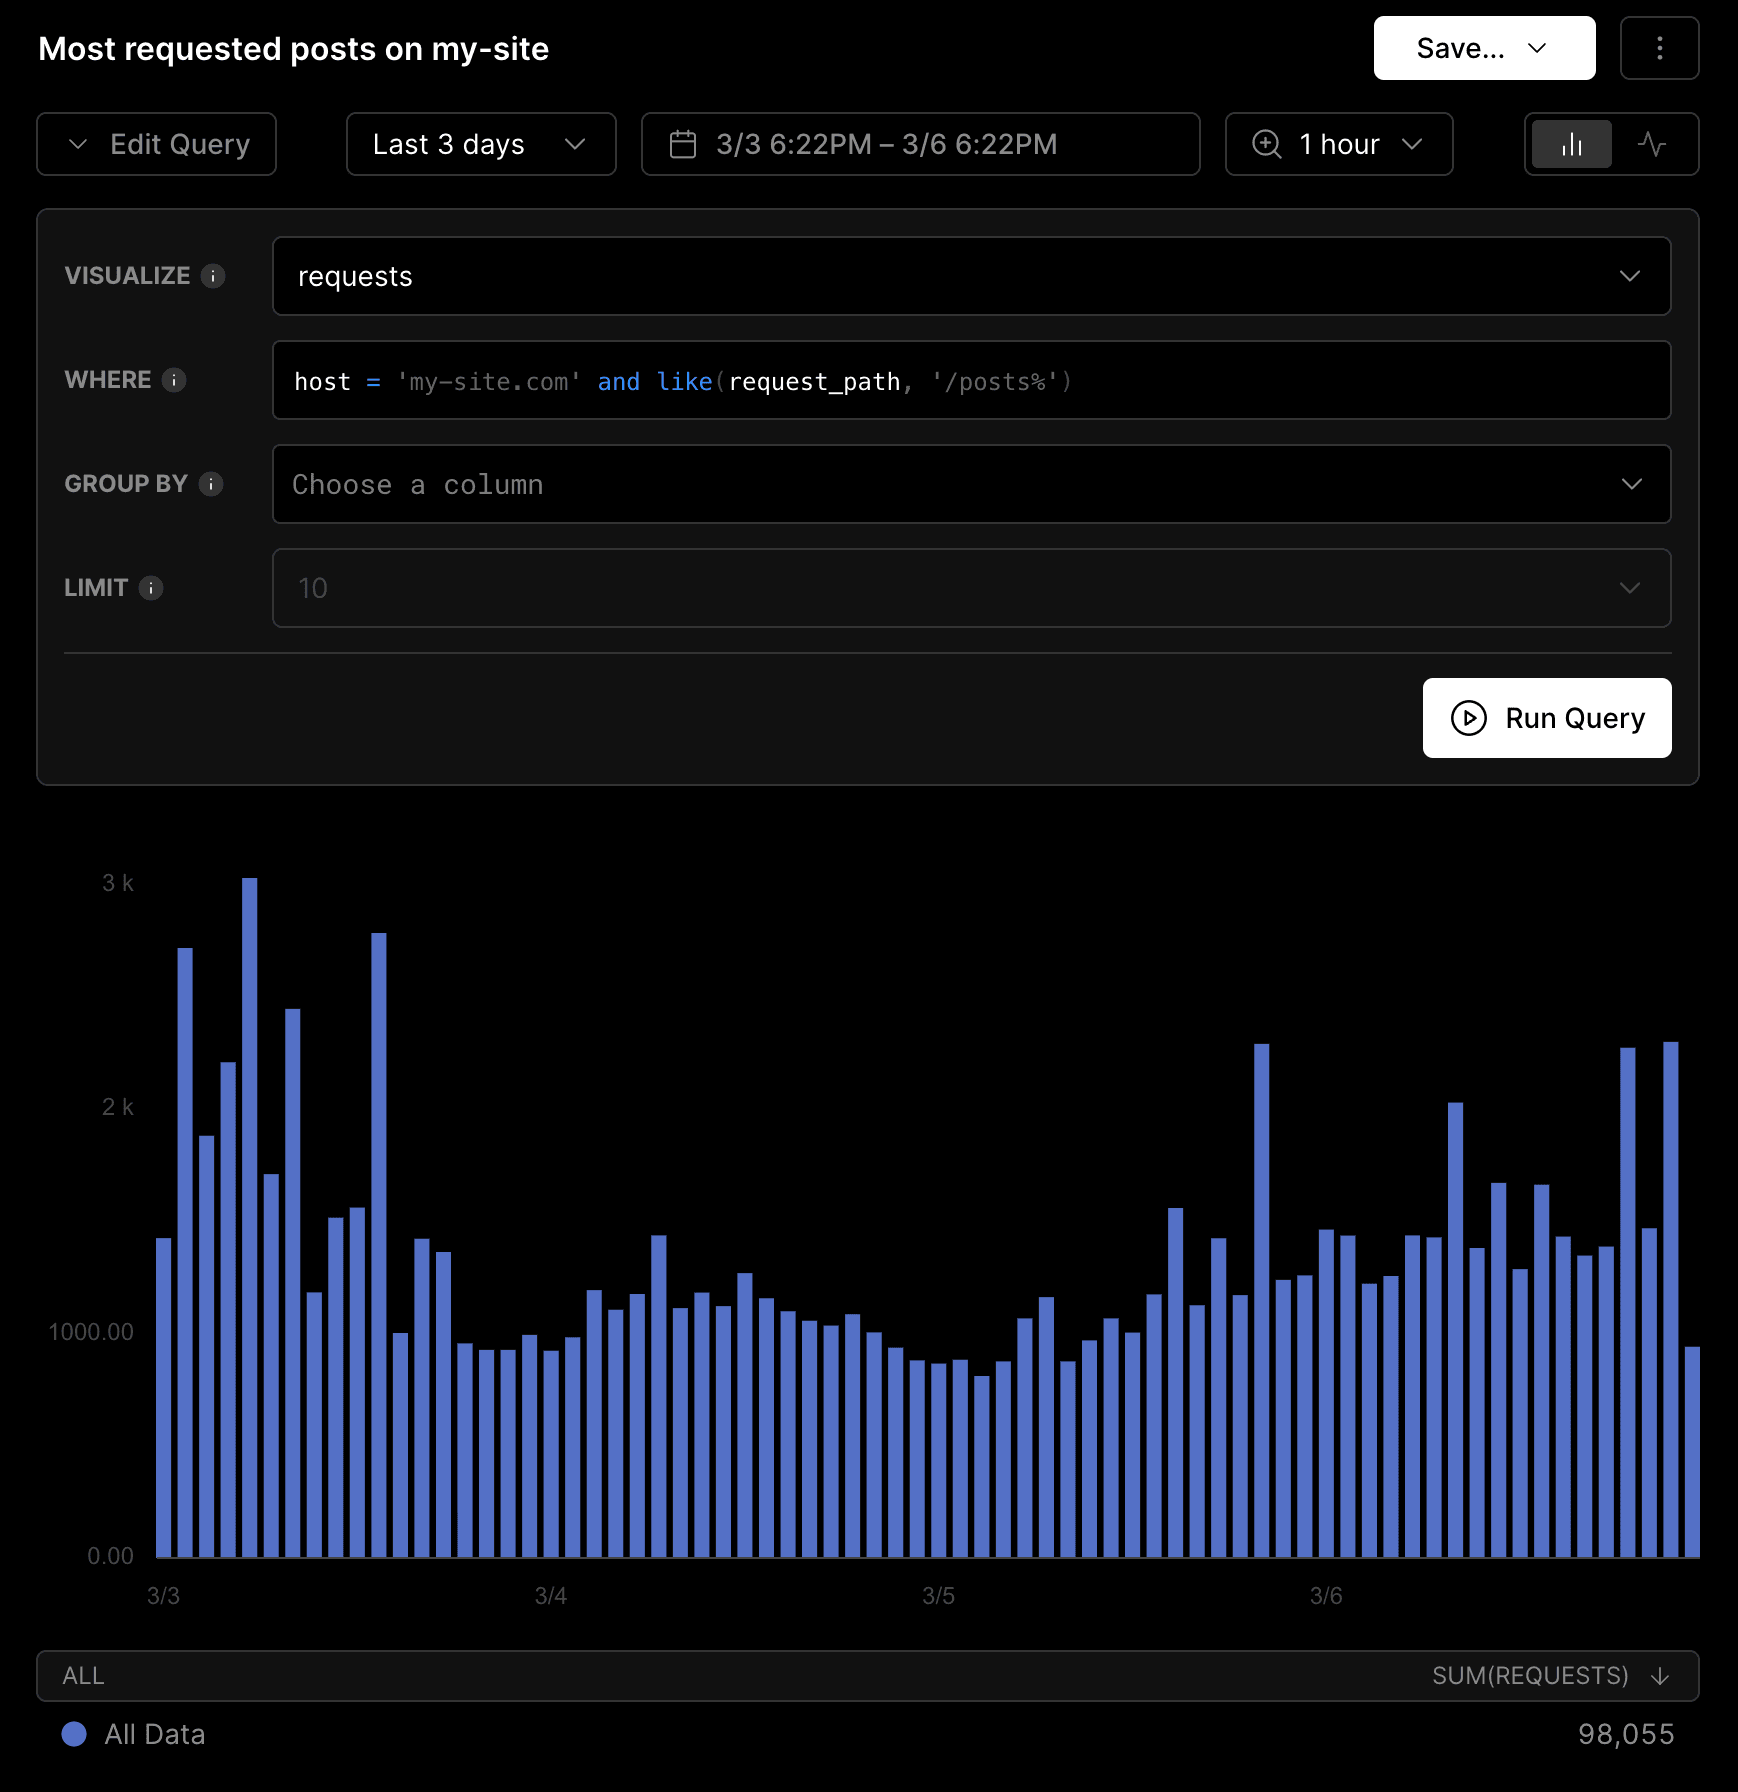
Configure Where clause to filter requests. Define a criteria that groups the data based on the selected attributes. The grouping mechanism is supported through the Group By clause.
Set the Group By clause to
request_path.With Visualize, Where, and Group By fields set, the Monitoring chart now shows the sum of
requeststhat are filtered based on therequest_path.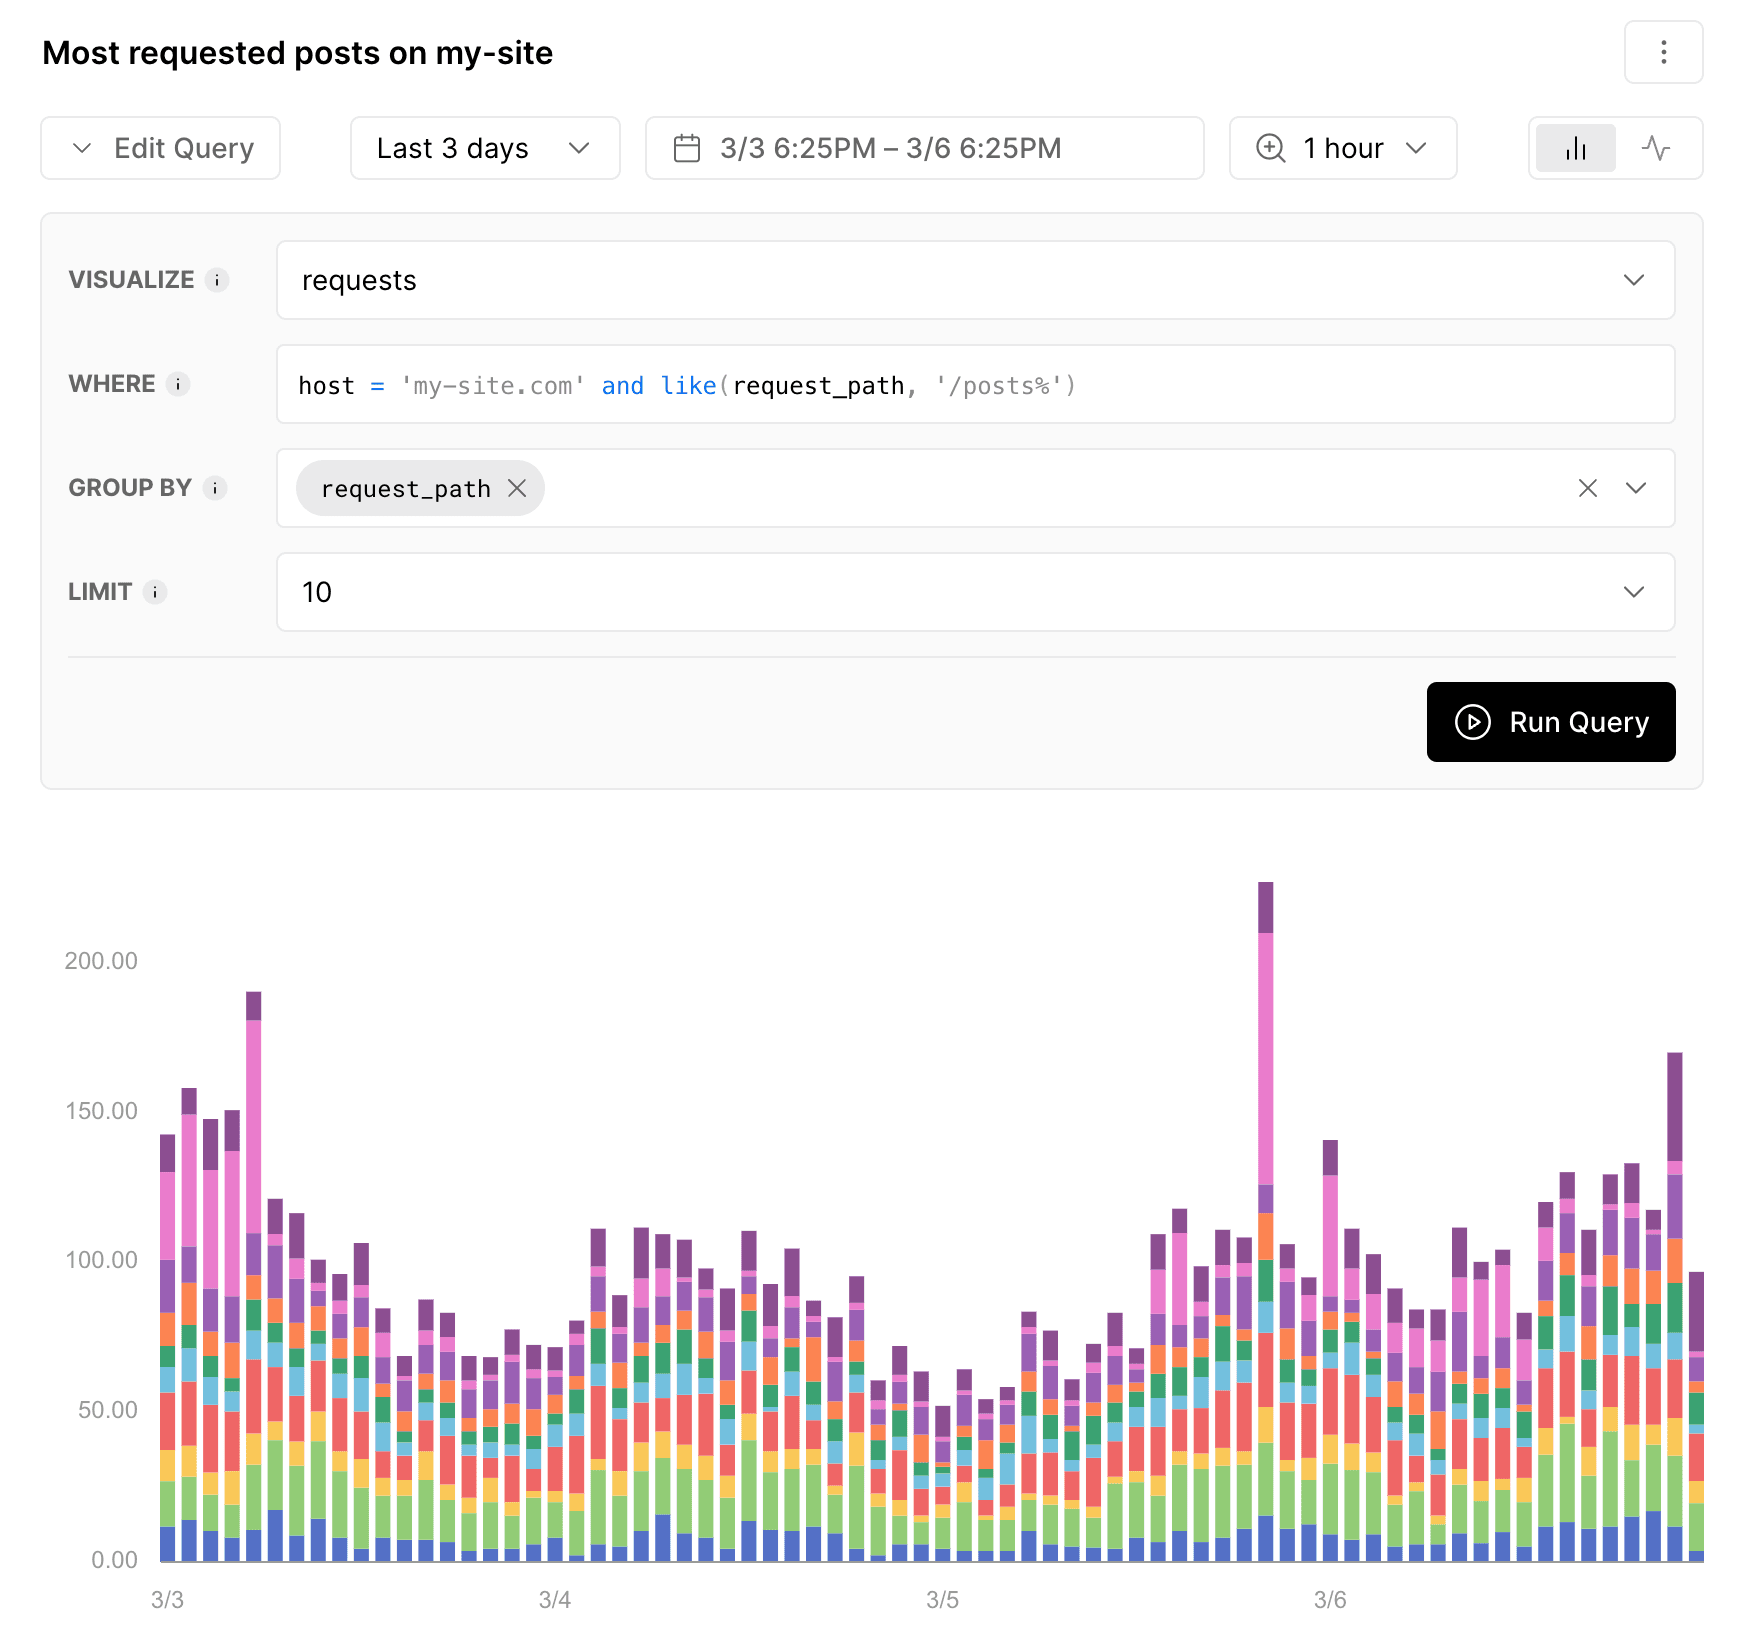
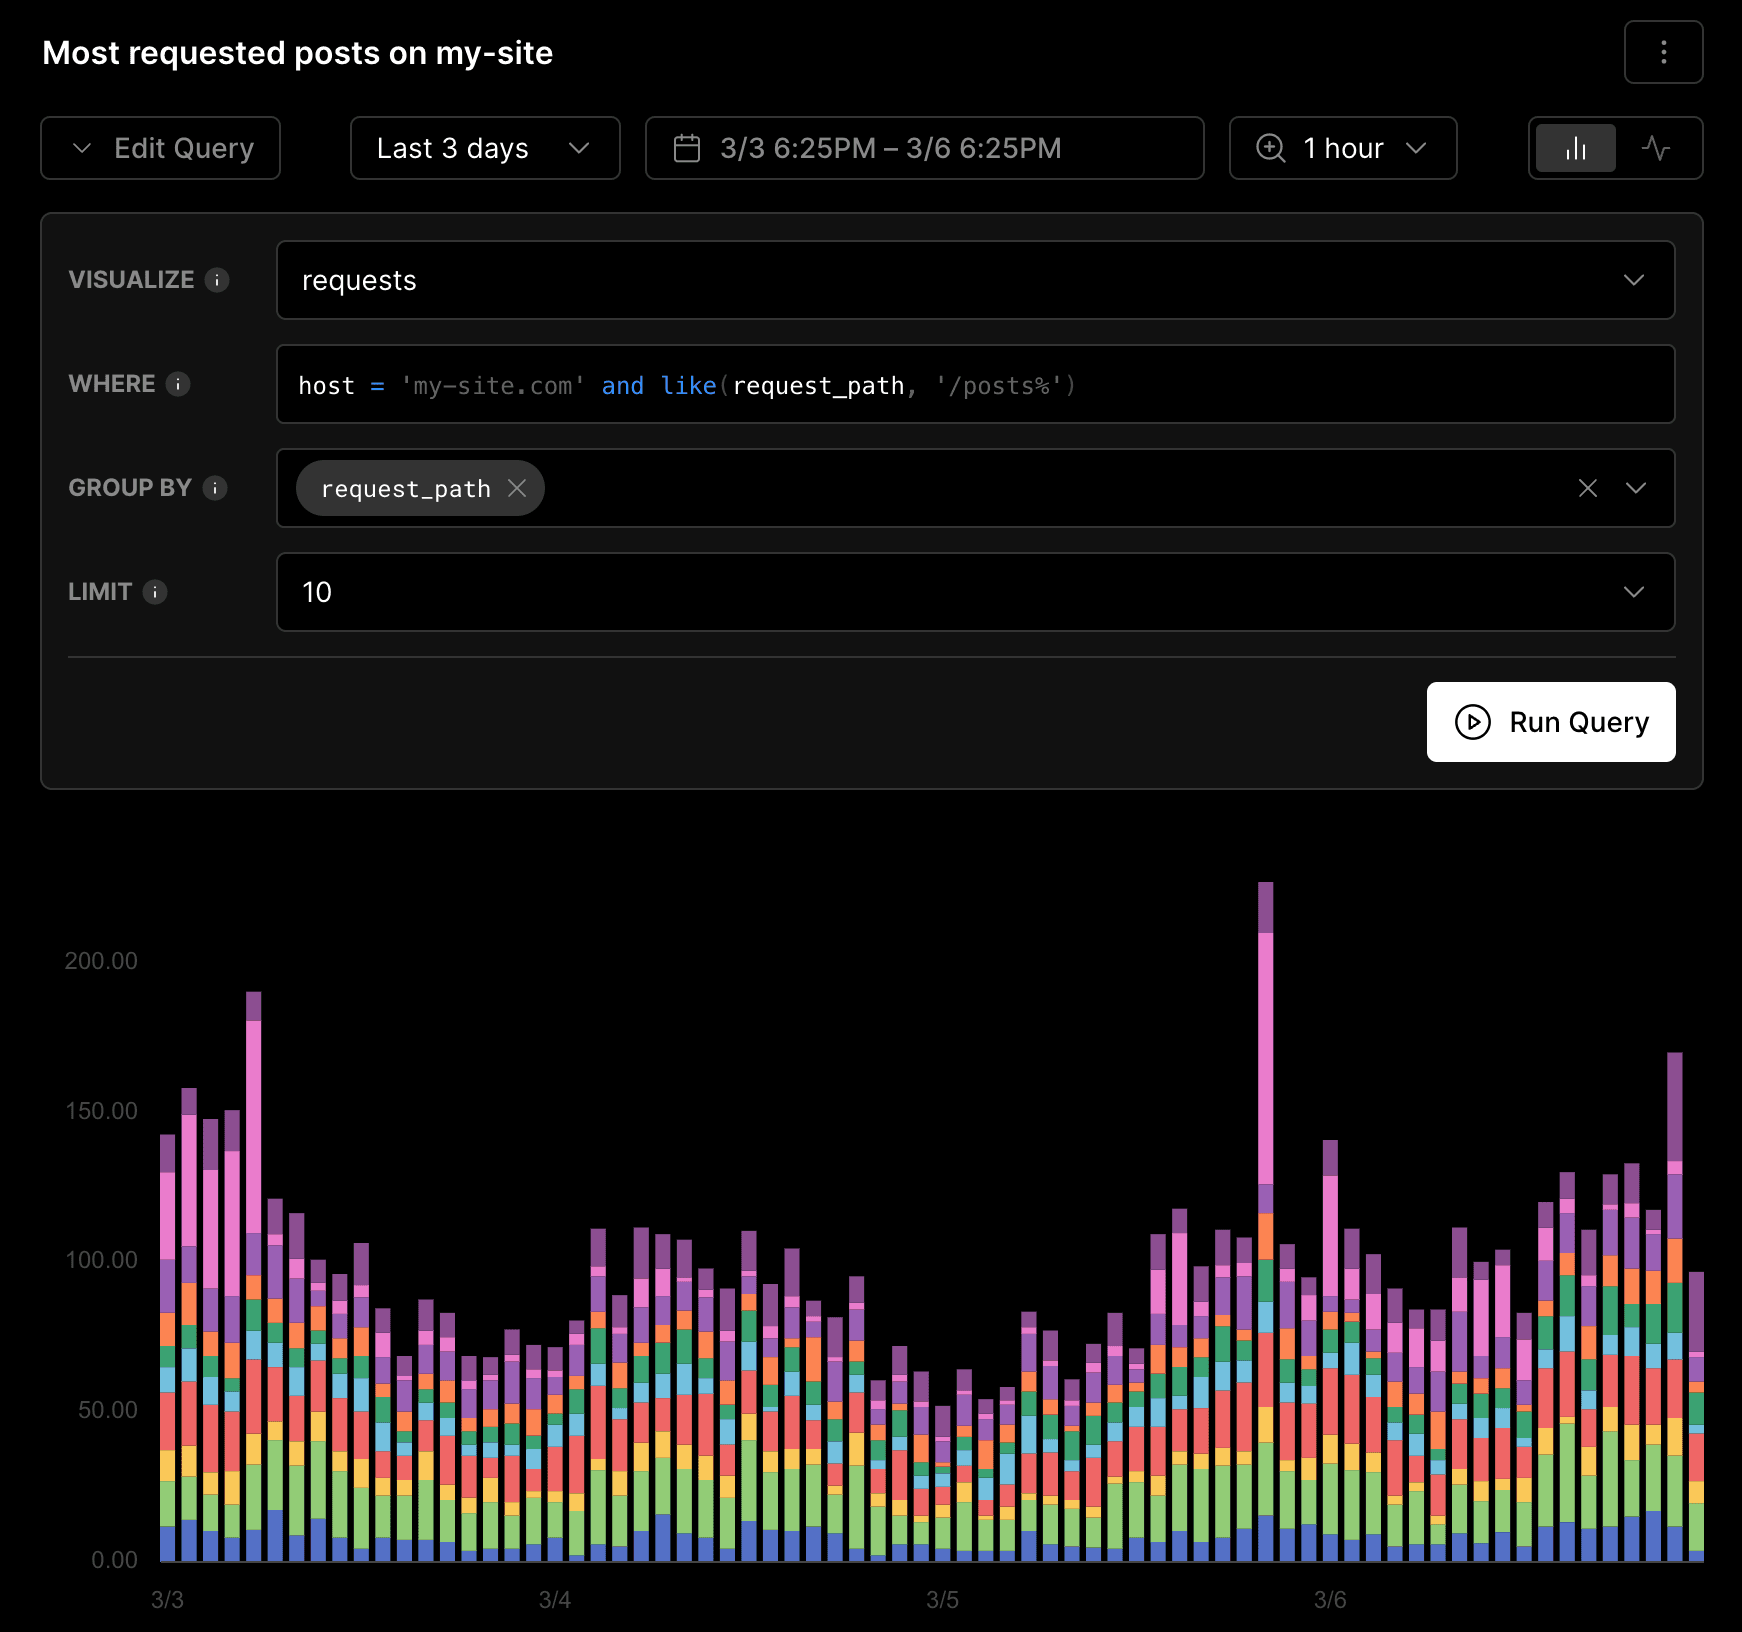
Configure Group By clause to segment events into groups. To control the number of results returned by the query, use the Limit clause and specify the desired number of results. You can choose from a few options, such as 5, 10, 25, 50, or 100 query results. For this example, set the limit to 5 query results.
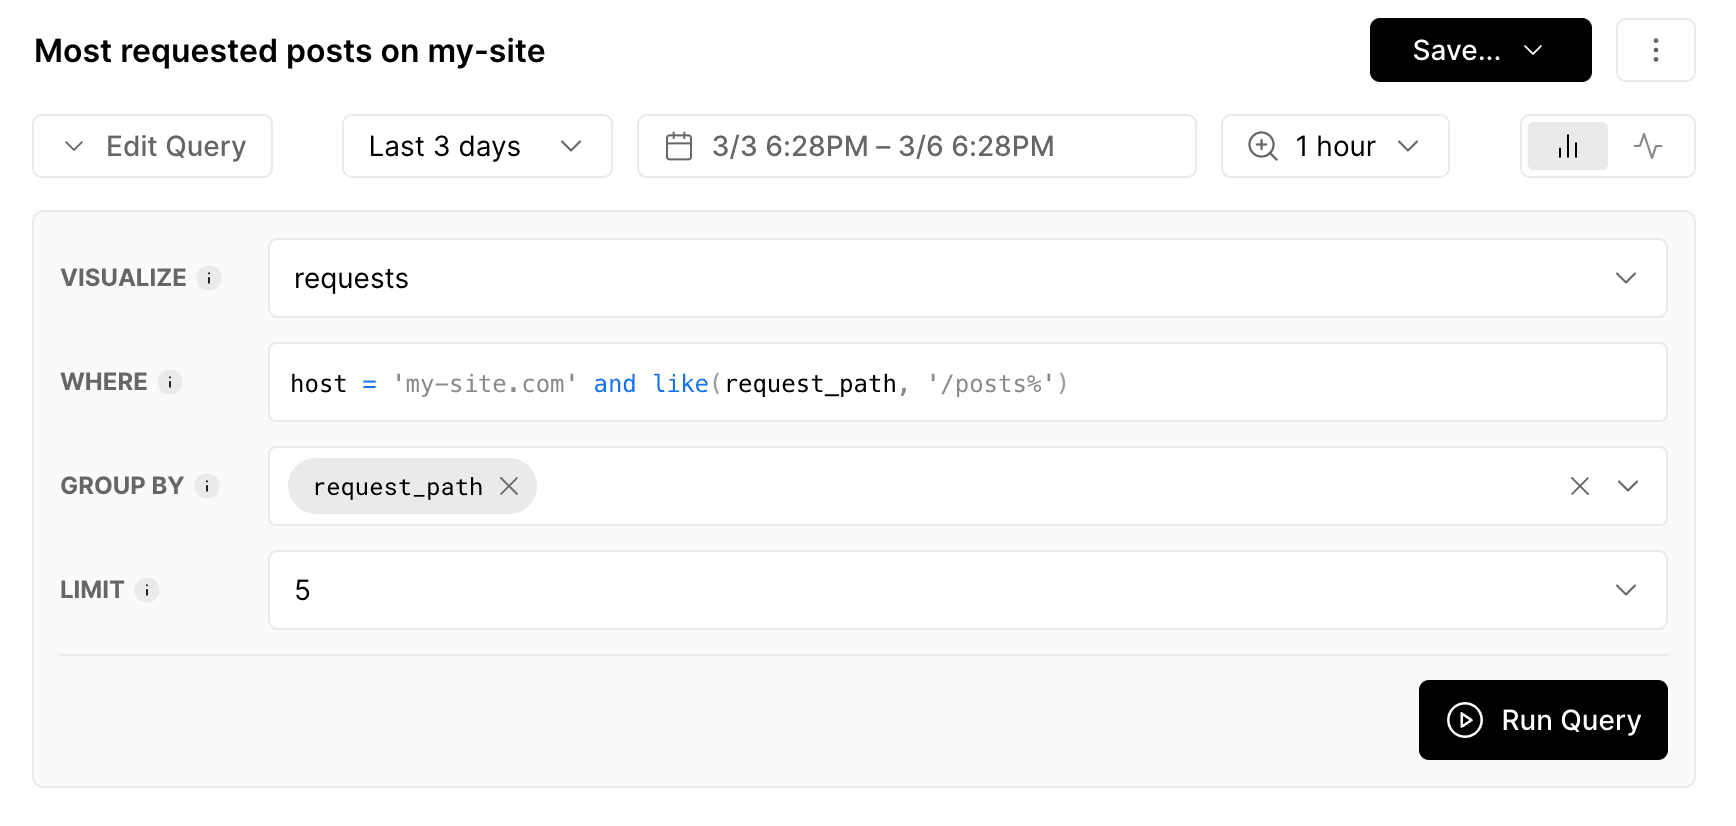
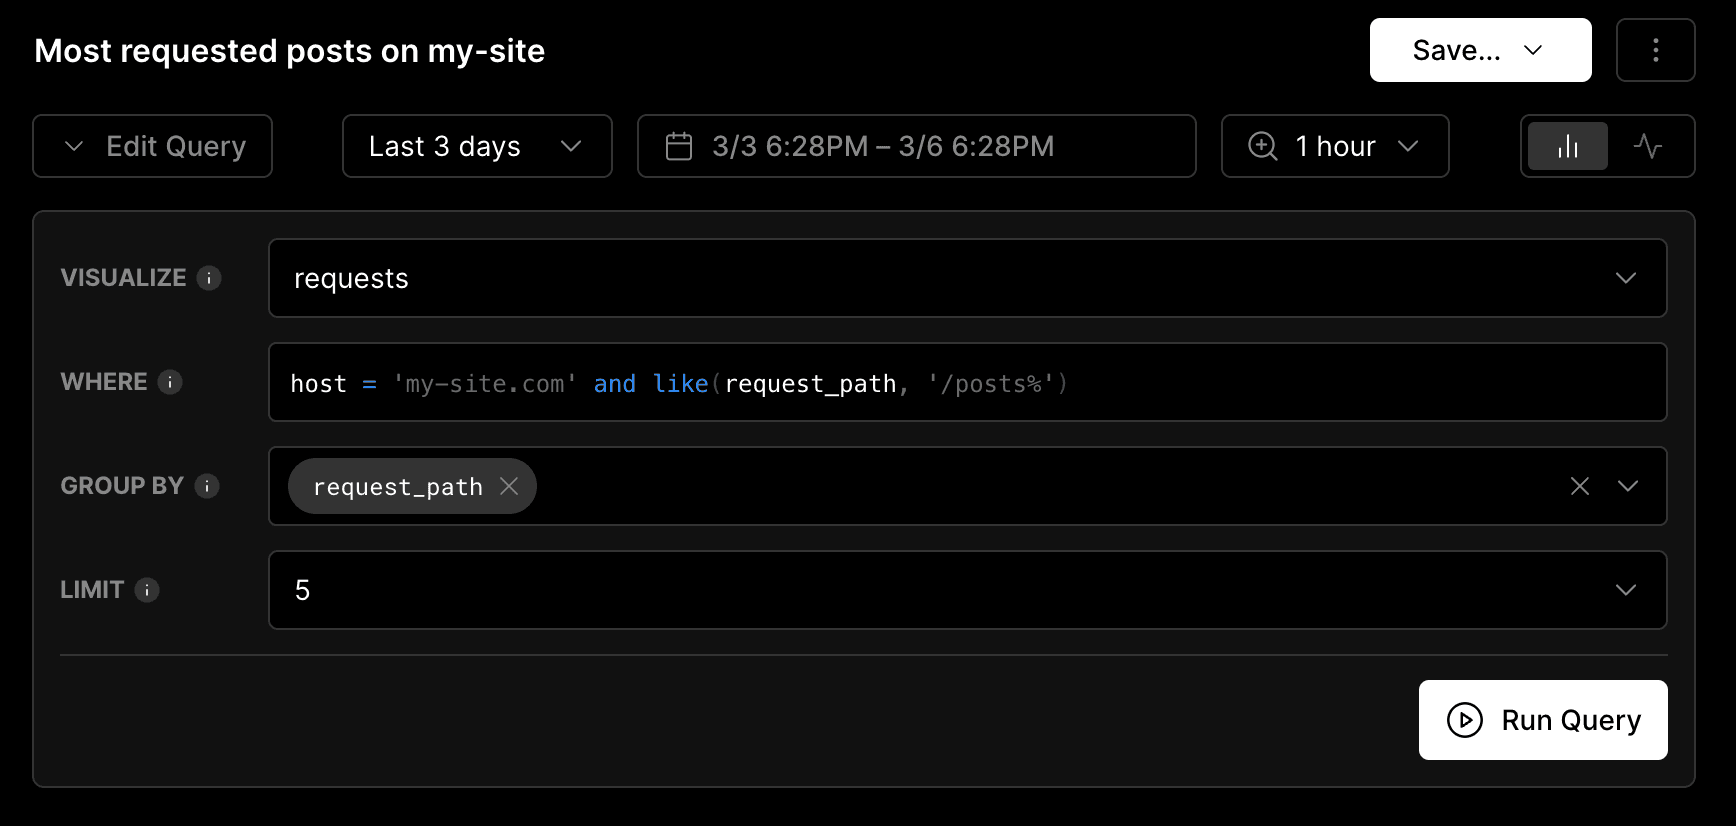
Configure Group By clause to segment events into groups. Save your query and click the Run Query button to generate the final results. The Monitoring chart will display a comprehensive view of the top 5 most requested posts on your website.
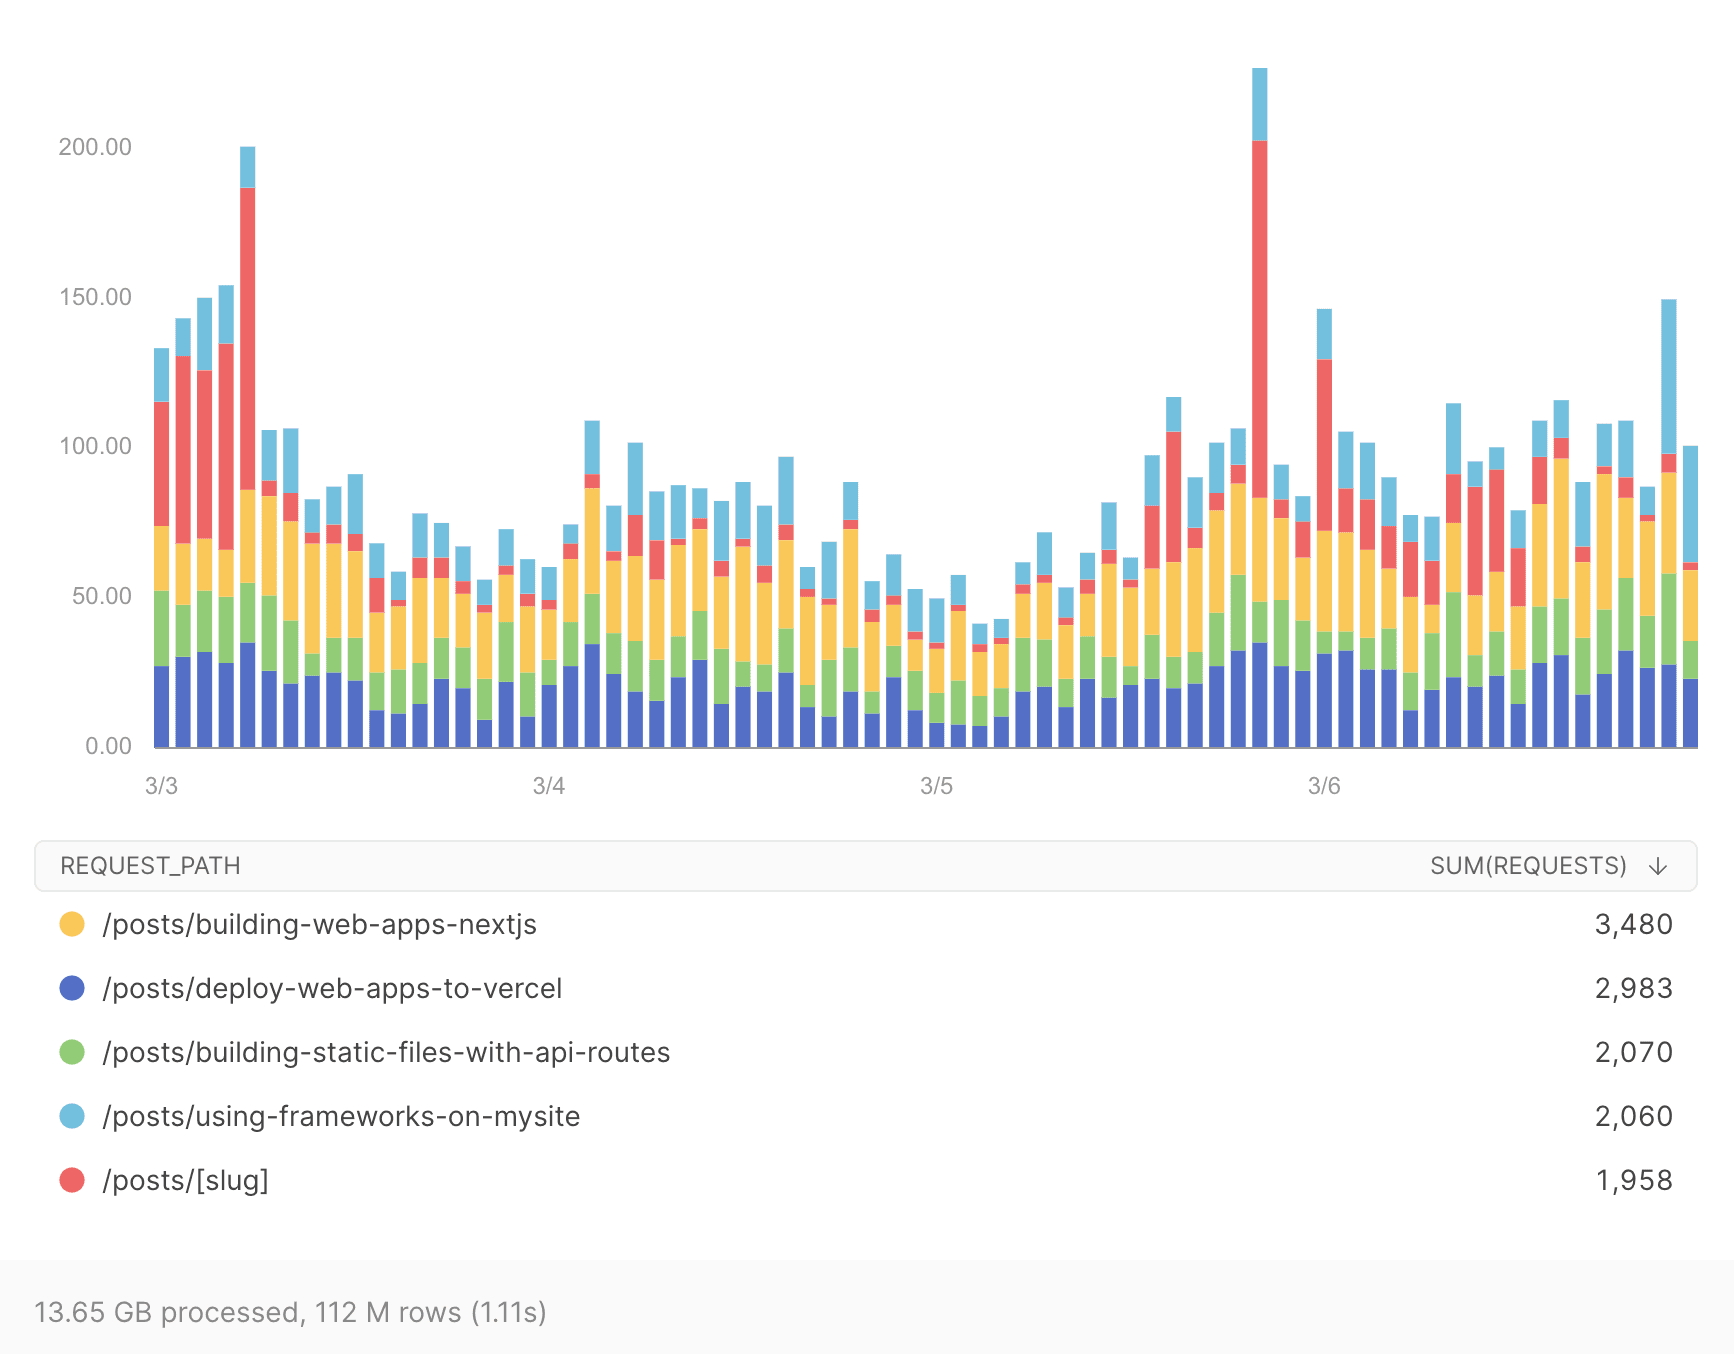
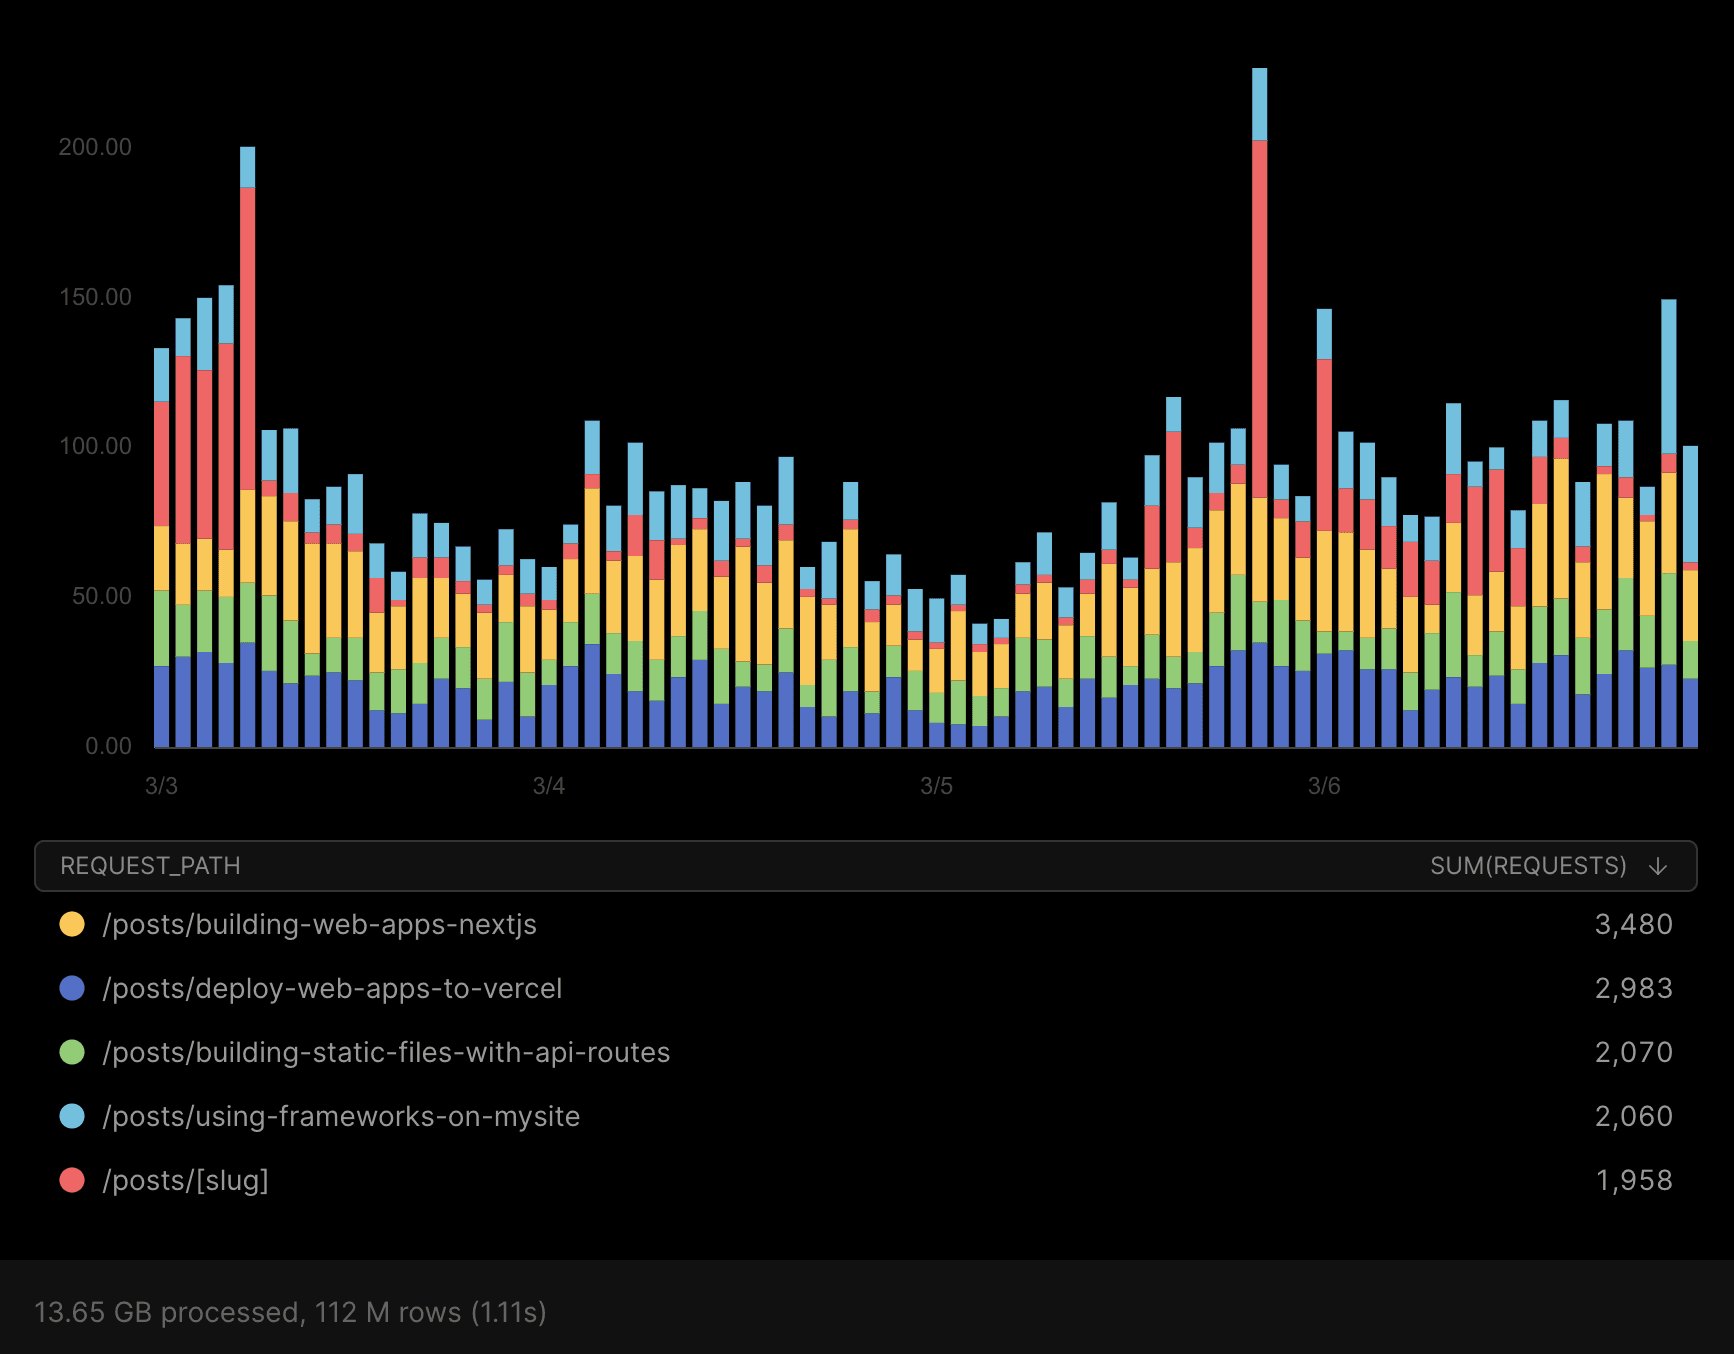
In-depth and full-scale monitoring for your five most requested posts.
Was this helpful?

