5 min read
Techniques and strategies we used to optimize your Dashboard for better UX.
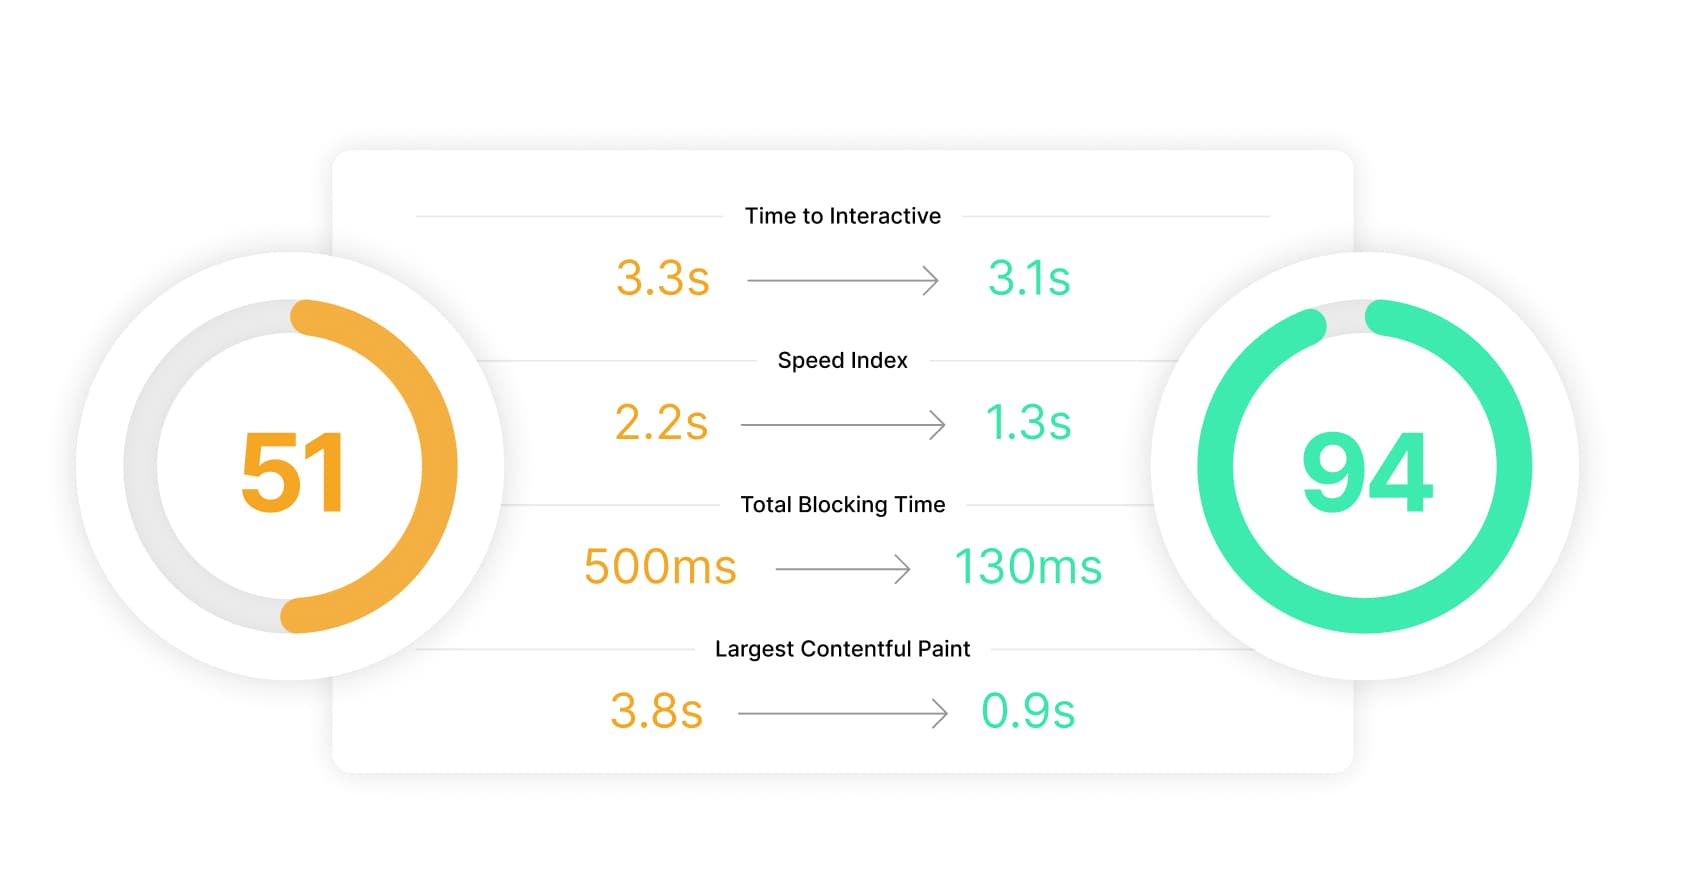
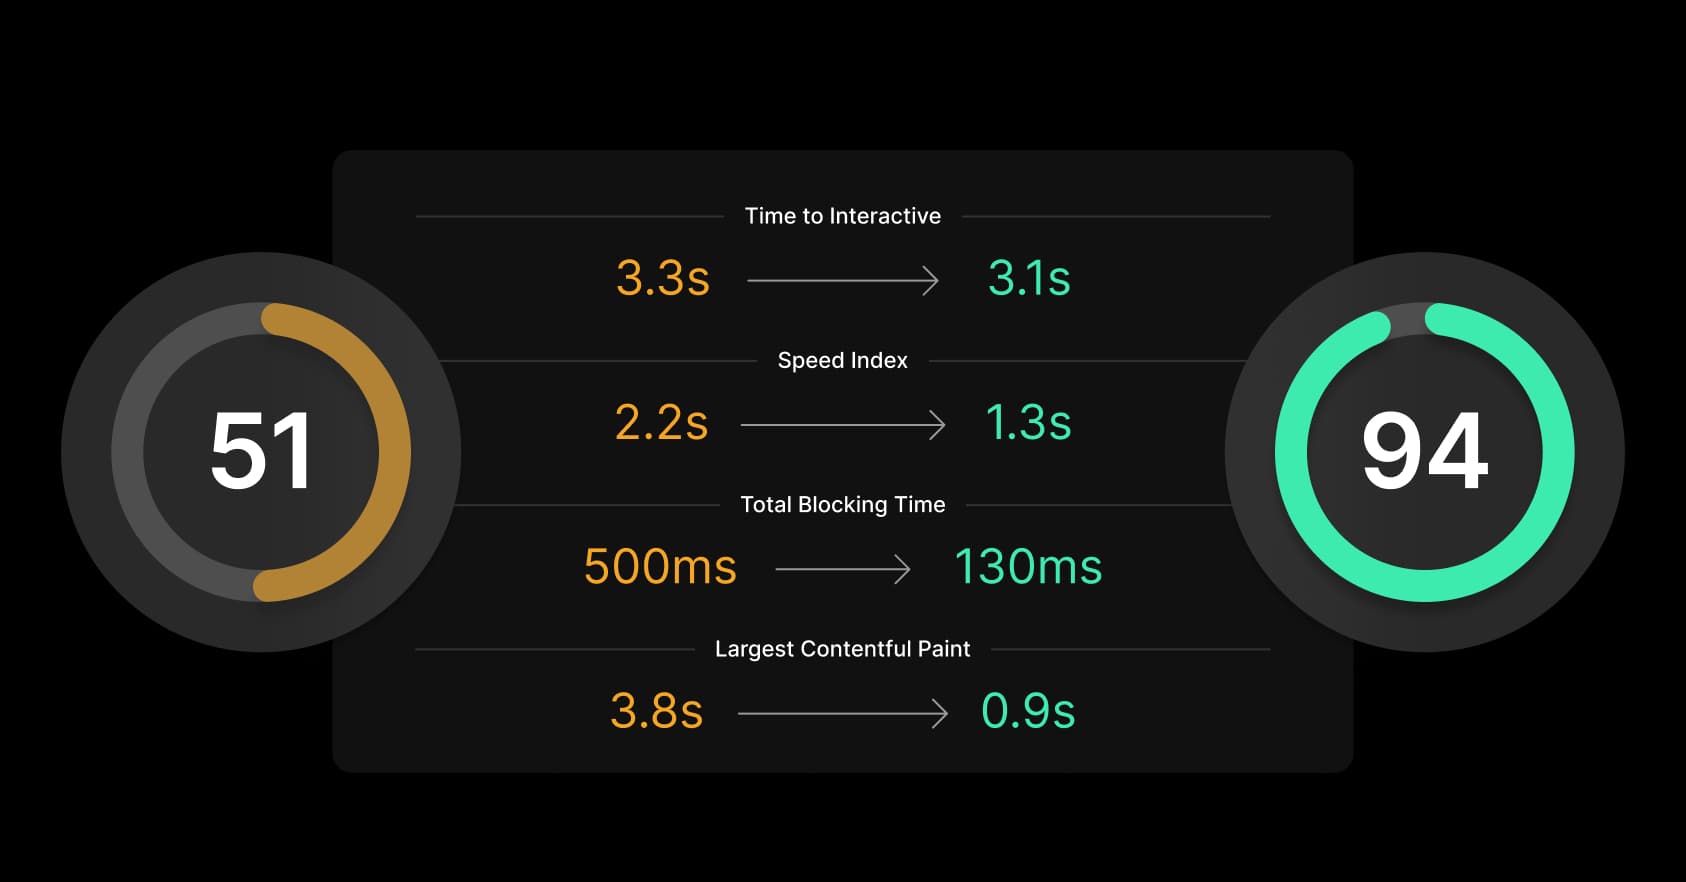
We want to keep the Vercel Dashboard fast for every customer, especially as we add and improve features. Aiming to lift our Core Web Vitals, our Engineering Team took the Lighthouse score for our Dashboard from 51 to 94.
We were able to confirm that our improvements had a real impact on our users over time using Vercel Analytics, noting that our Vercel Analytics scores went from 90 to 95 on average (desktop). Let’s review the techniques and strategies we used so you can make a data-driven impact on your application.
Link to headingOptimize what matters most
Your users expect pages to load quickly. Certain parts of your application will have an outsized impact on performance depending on how frequently they are executed or how heavy their workload is. Let’s refer to these as “hot paths.”
On frontend applications, the hot path typically performs initial page loads. Cutting down time on your hot path means faster page loads, better UX, and better Core Web Vitals. We were able to improve First Contentful Paint (FCP), Largest Contentful Paint (LCP), and First Input Delay (FID)s using a few powerful tools.


Link to headingTools to guide you
To find out what code lives on your hot path, use Chrome's Devtools and React Developer Tools. Chrome Devtools are great for debugging any web application, while React Developer Tools specifically diagnose React applications. These tools will produce flame graphs, charts, and timelines that allow you to take a deeper look at your application.
But Devtools will only tell you part of the story—a single point in time. You can diagnose the page that you just loaded—but what if we had a way to determine which paths are the most important to our application over time?
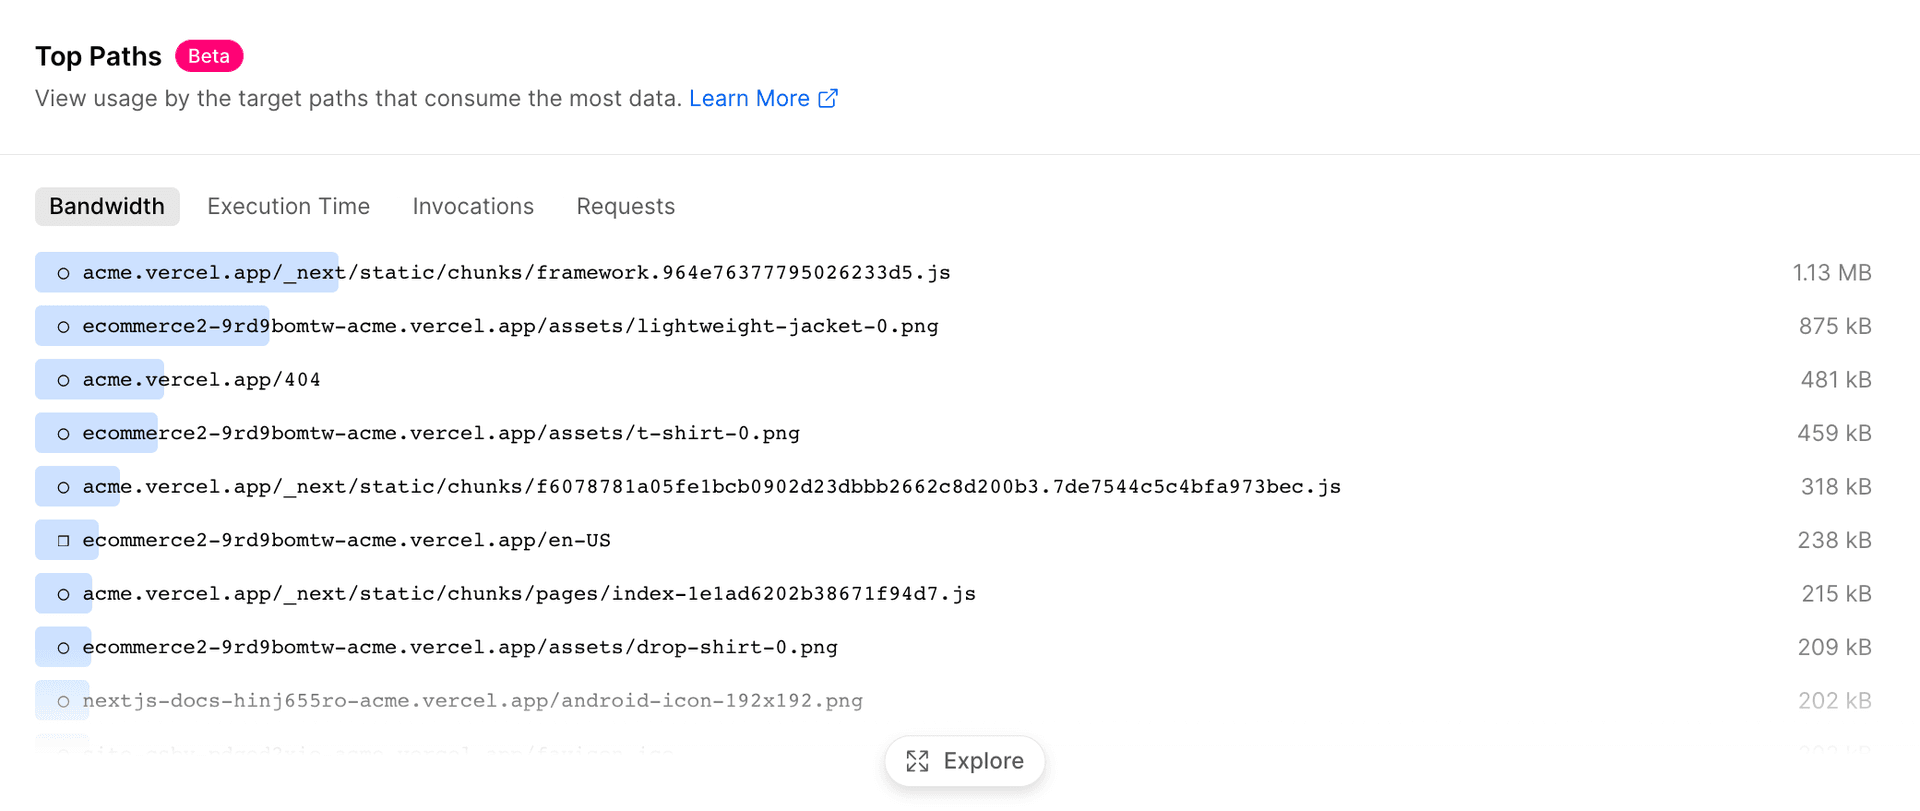
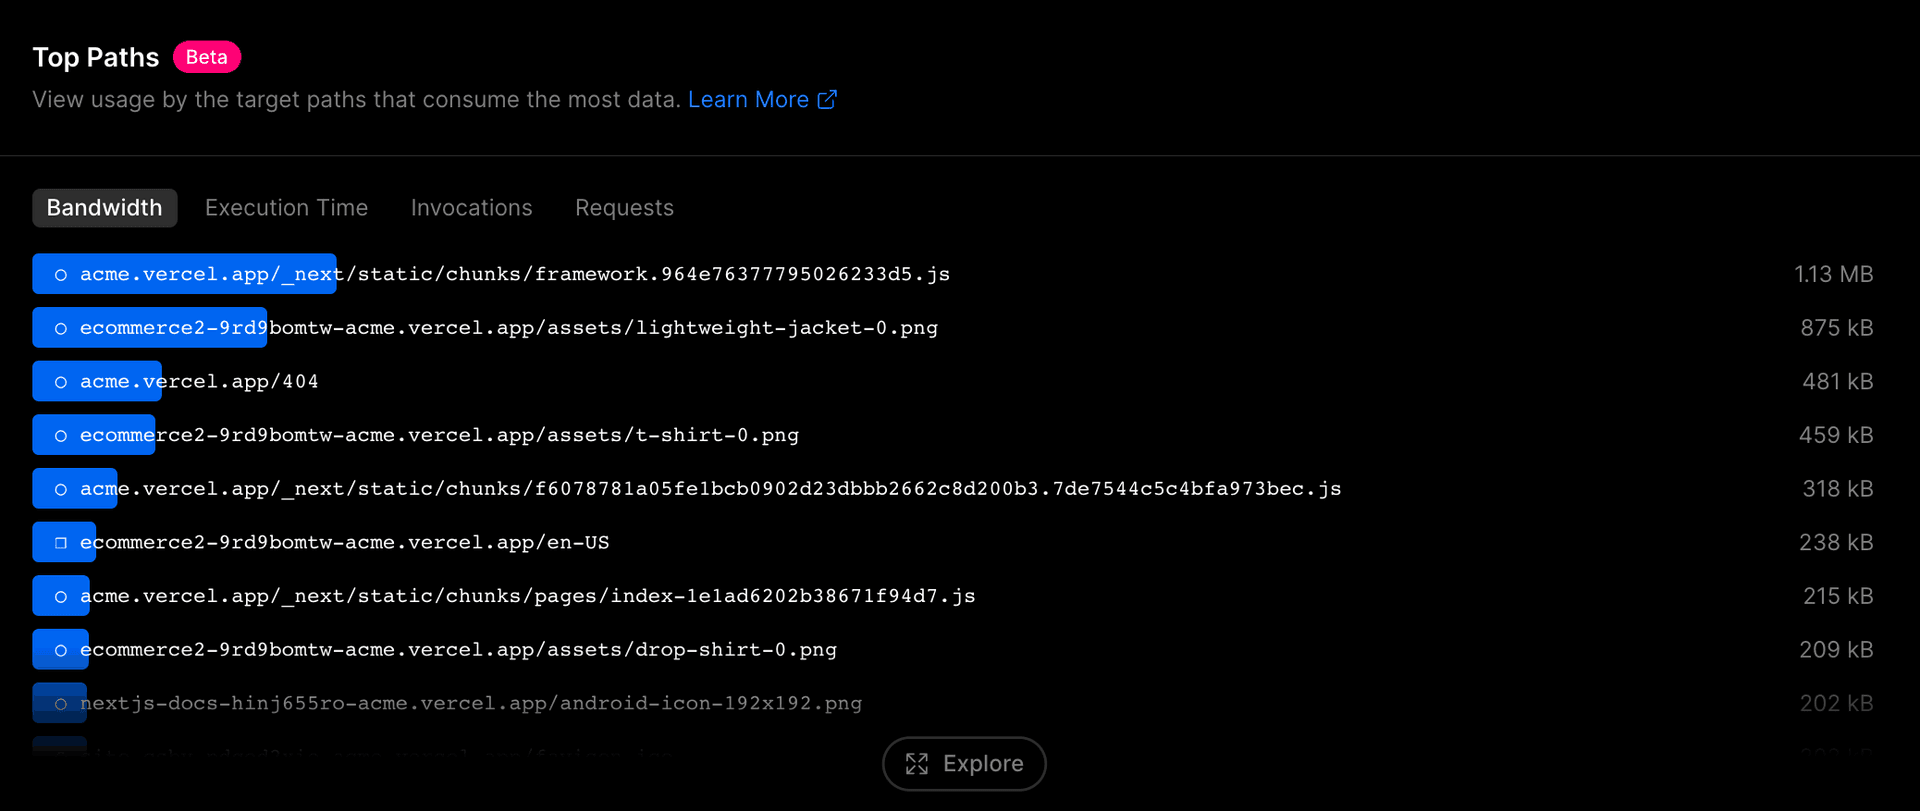
With Vercel, Top Paths answers this question. Top Paths shows you which assets your site’s users are downloading most often and how heavy those paths are.
You’ll be able to quickly find which images, static data, and other assets are the most important ones for you to optimize, focusing your efforts where they matter most. Top Paths is currently available for all Vercel plans.


Link to headingYour page–faster
Now that we know where to look, let’s figure out how to get those paths shorter.
After identifying the hot path on the Dashboard, we were able to find plenty of high value opportunities. Here are some of the strategies we used to improve the performance of the Vercel Dashboard.
Link to headingJavaScript
JavaScript gives the page interactivity, but is also the heaviest, slowest asset we send to the browser in modern applications. For performance, the less JavaScript, the better.
Be mindful of your utility functions.
Our isLoggedIn() utility checks for a user's authentication by reading a document.cookie value. This is quick when it happens once - but we were calling isLoggedIn() over 400 times in one render pass.
With some rearchitecting, we were able to remove many of these calls, bringing a ~270ms render time down to just ~90ms.
Leverage the effects of caching.
On the Vercel Dashboard, we are using a slugify function that takes 1-3ms to evaluate. While that’s fast only once, we were calling this function hundreds of times for our initial render. Once we cached the computed results, we made the render process ~200ms faster.
// Create a cache using an empty objectconst slugifyCache = { }
const cachedSlugify = (text: string) => { // If this value has already been computed, // it will be a property on the cache object. if (slugifyCache[text]) { return slugifyCache[text] }
// If this is the first time we are seeing this string, // we will store it in our cache and return the slug. return (slugifyCache[text] = slugify(text))}Know your imported code.
Libraries often have to cover all sorts of edge cases to take care of thousands of developers. While that provides for a generally safe experience, that safety often means more code to execute.
Does your use case of the library need to cover those edge cases? If not, can you write your own function in a more efficient way?
Strategically lazy load heavy components.
Elements that aren’t in your user’s viewport on page load can have their render delayed. First, let's build a hook for detecting if an element is in the viewport.
const useInViewport = (ref: any) => { const [isInViewport, setIsInViewport] = useState(false) const [isLoaded, setIsLoaded] = useState(false)
useEffect(() => { const observer = new IntersectionObserver( ([entry]) => { if (entry.isIntersecting) { setIsLoaded(true) }
setIsInViewport(entry.isIntersecting) } )
if (ref.current) { observer.observe(ref.current) } }, [ref])
return isInViewport || isLoaded}Now, let's use it. The 200vh element will push the <HeavyChildComponent /> below our viewport on page load. Before you scroll down, check your browser's Devtools. You'll notice that the HTML markup for this React component hasn't loaded into the DOM yet.
const HeavyChildComponent = () => { return ( <div> <p>I am a heavy component!</p> </div> )}
const ParentComponent = () => { const childRefContainer = useRef(false) const isRendered = useInViewport(childRefContainer)
return ( <> <div style={{height: "200vh"}}></div> <div ref={childRefContainer as any}> { isRendered && <HeavyChildComponent /> } </div> </> )}Third-party scripts
You’ll often need to introduce third-party scripts for analytics, A/B testing, and more. While these scripts can have negative impacts on page performance, we can minimize their effects on LCP and FID with the right techniques.
Most popular packages use “tree-shaking” to remove unused code automatically for the smallest JavaScript bundles. Ensure you’re using correct ES Modules imports as shown below.
// Before// This line imports the entire Sentry package!import Sentry from '@sentry/nextjs'
// After// Only bring in the code that it needs.import { captureException } from '@sentry/nextjs'Some packages (like Stripe) have the ability to lazy load their
scriptuntil your user needs it. Less initial code, quicker page loads.Choosing the right
next/scriptstrategy is crucial to improving the performance of your third party scripting. For example, Google Tag Manager can be lazily loaded to noticeably improve LCP and FID. Check the strategies included in the next/script documentation for more.
Link to headingHTML + CSS
Optimizing HTML and CSS offers us the smallest performance gains because of how quickly modern browsers parse the DOM. But we can still find small wins that add up to meaningful change.
Find needless markup duplications.
React makes it easy to reuse code. This is great—but has a dark side since we can also reuse unoptimized code. If you’re introducing purposeless tags in your JSX, eliminate them. If you’re writing the same CSS multiple times, think about some reusable CSS class declarations.
// Beforeconst Paragraph = (props) => { return ( <div> <p>{ props.children }</p> </div> )}
// Afterconst Paragraph = (props) => { return ( // No more wrapper div! The p tag already defaults to display: block; // so this change won't change the final render. <p style={{ props.style }}>{ props.children }</p> )}Leverage Next.js optimizations.
<Image /> will deliver the optimal image size for your user’s device, ensuring minimal image processing, and, in turn, speeding up page loads. Additionally, Next.js will automatically inline font CSS at build time, eliminating an extra fetch for font declarations.
// Beforeconst ImageWithCaption = (props) => { return ( <figure> // Image source is way too large for mobile! <img src="./images/sample-img.png" alt="This is a sample image!" /> <figcaption>{props.figCaption}</figcaption> </figure> )}
// Afterimport Image from "next/image"
const ImageWithCaption = (props) => { return ( <figure> // Delivers correct size for user <Image src="./images/sample-img.png" alt="This is a sample image!" layout="responsive" width={200} height={100} /> <figcaption>{props.figCaption}</figcaption> </figure> )}Use variable fonts.
Traditional font files contain only one font face—but you'll need many variations to create beautiful typefaces for your application. Variable fonts can load just one file to define a @font-face rule for every variation of your font.
@font-face { font-family:'Inter'; src:url('Inter.woff2')format('woff2')tech('variations'), url('Inter')format('woff2-variations'); font-weight: 100 1000; // Range for declarations of the property font-stretch: 25% 150%;}Let the browser work for you.
Assigning properties to their browser defaults can add up over time—without bringing any new styles to the page. Continue reducing the size of your markup by letting the browser use its defaults rather than declaring those CSS properties yourself.
// Beforeconst ReusableSection = ( props ) => { return ( // Setting 0 for the margin is the browser default. // This will have no styling effect, // but it will add bloat to your final HTML. <div style={{ marginTop: props.marginTop || 0 }}> <p style={{ paddingBottom: props.paragraphBottomPad || 0 }}> {props.paragraph} </p> </div> )}
// Afterconst ReusableSection = (props) => { return ( // This style tag will no longer be a part of your final HTML. <div style={{ marginTop: props.marginTop || undefined }}> <p style={{ paddingBottom: props.paragraphBottomPad || undefined }}> {props.paragraph} </p> </div> )}Link to headingUse data to improve user experience
As your application grows, it can be hard to maintain performance. Scaling can be difficult. New features are often in high demand. And the needs of a growing business can take the focus off of application performance.
Vercel Analytics and Top Paths allowed us to quickly peek into our Dashboard and find where it was underperforming. That meant less time diagnosing, and a better opportunity for our developers to focus on performance.
As a part of our continued effort to help developers improve their application performance, we're looking to add automated reporting on regressions for your Vercel Analytics data.
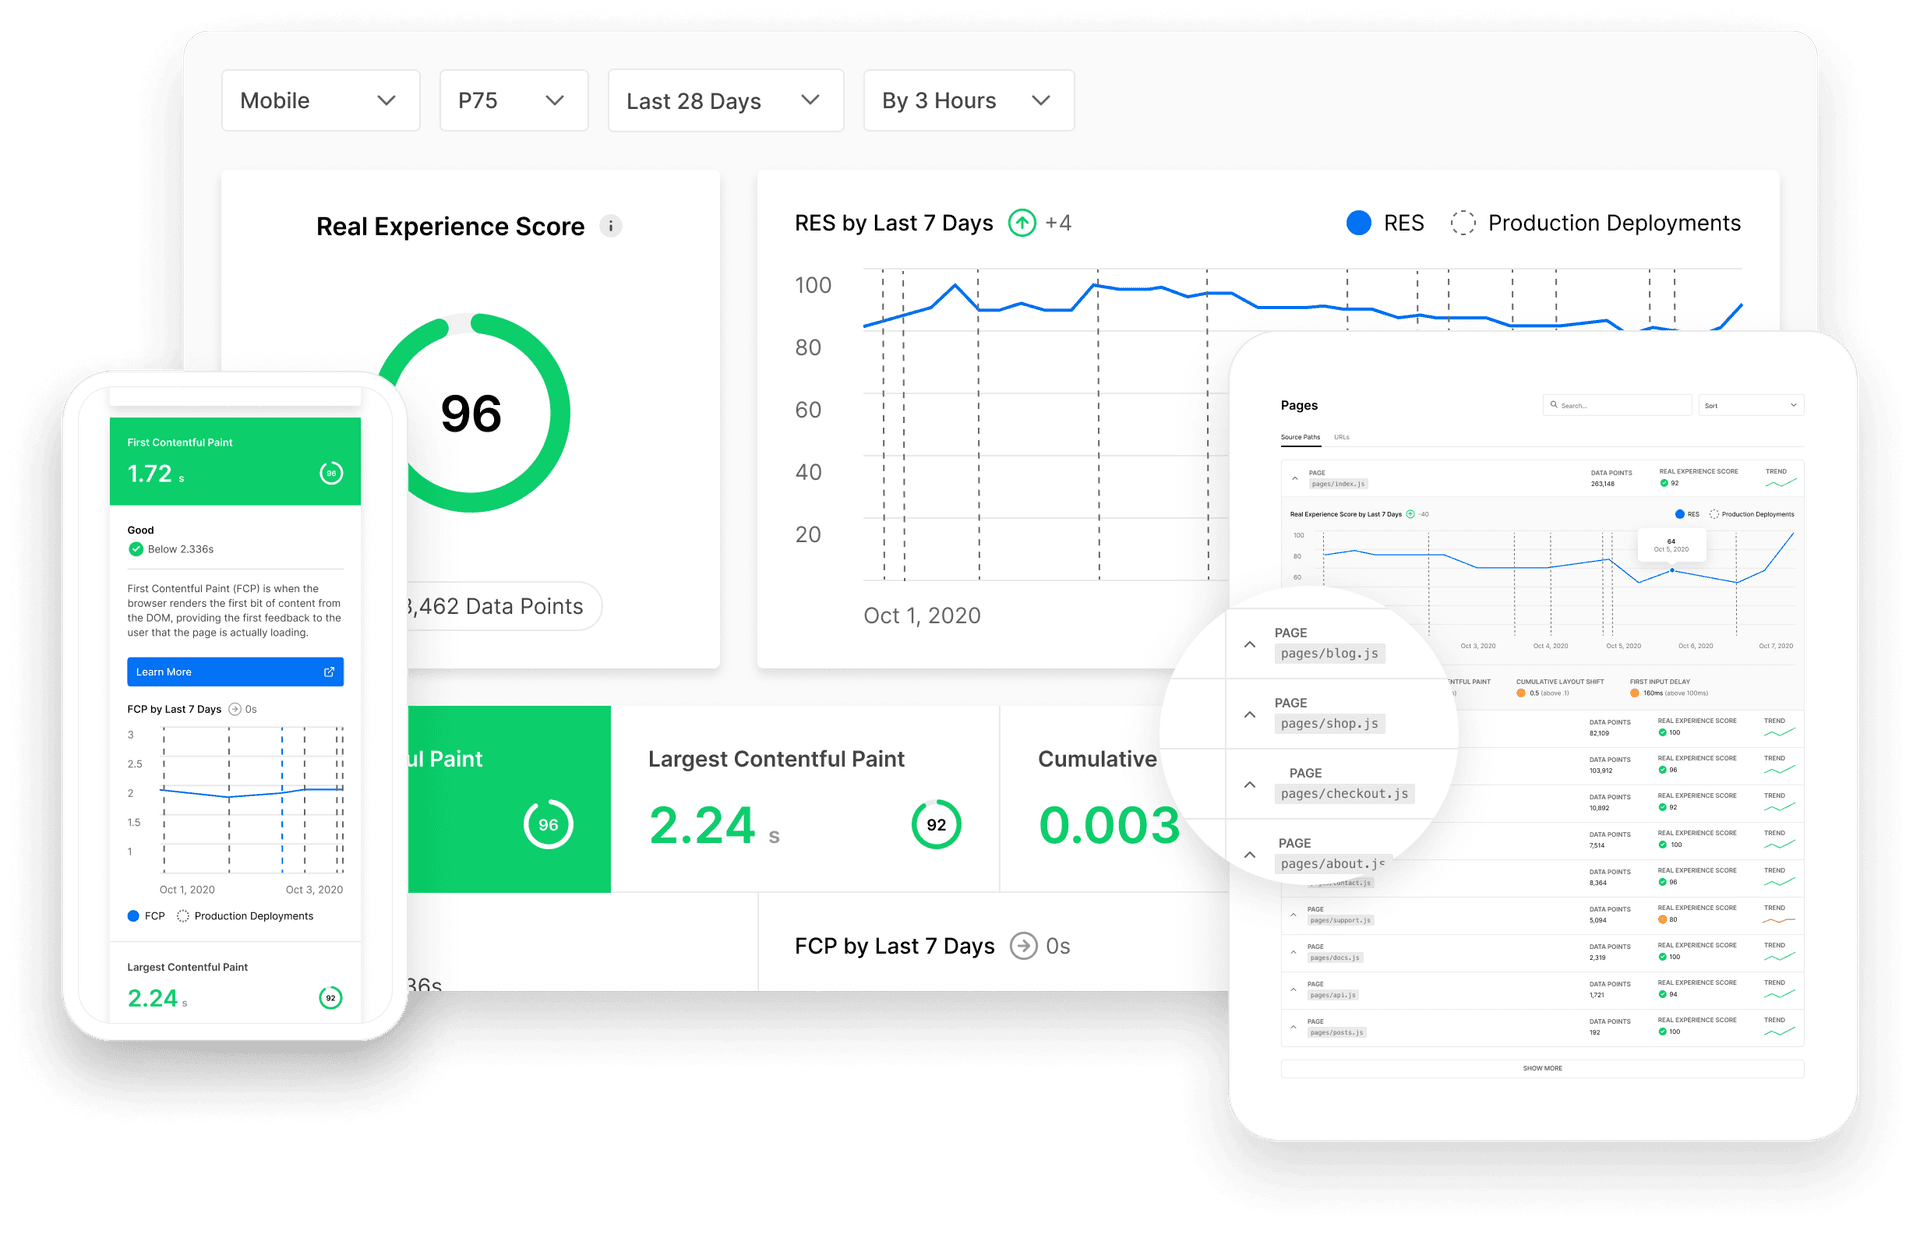
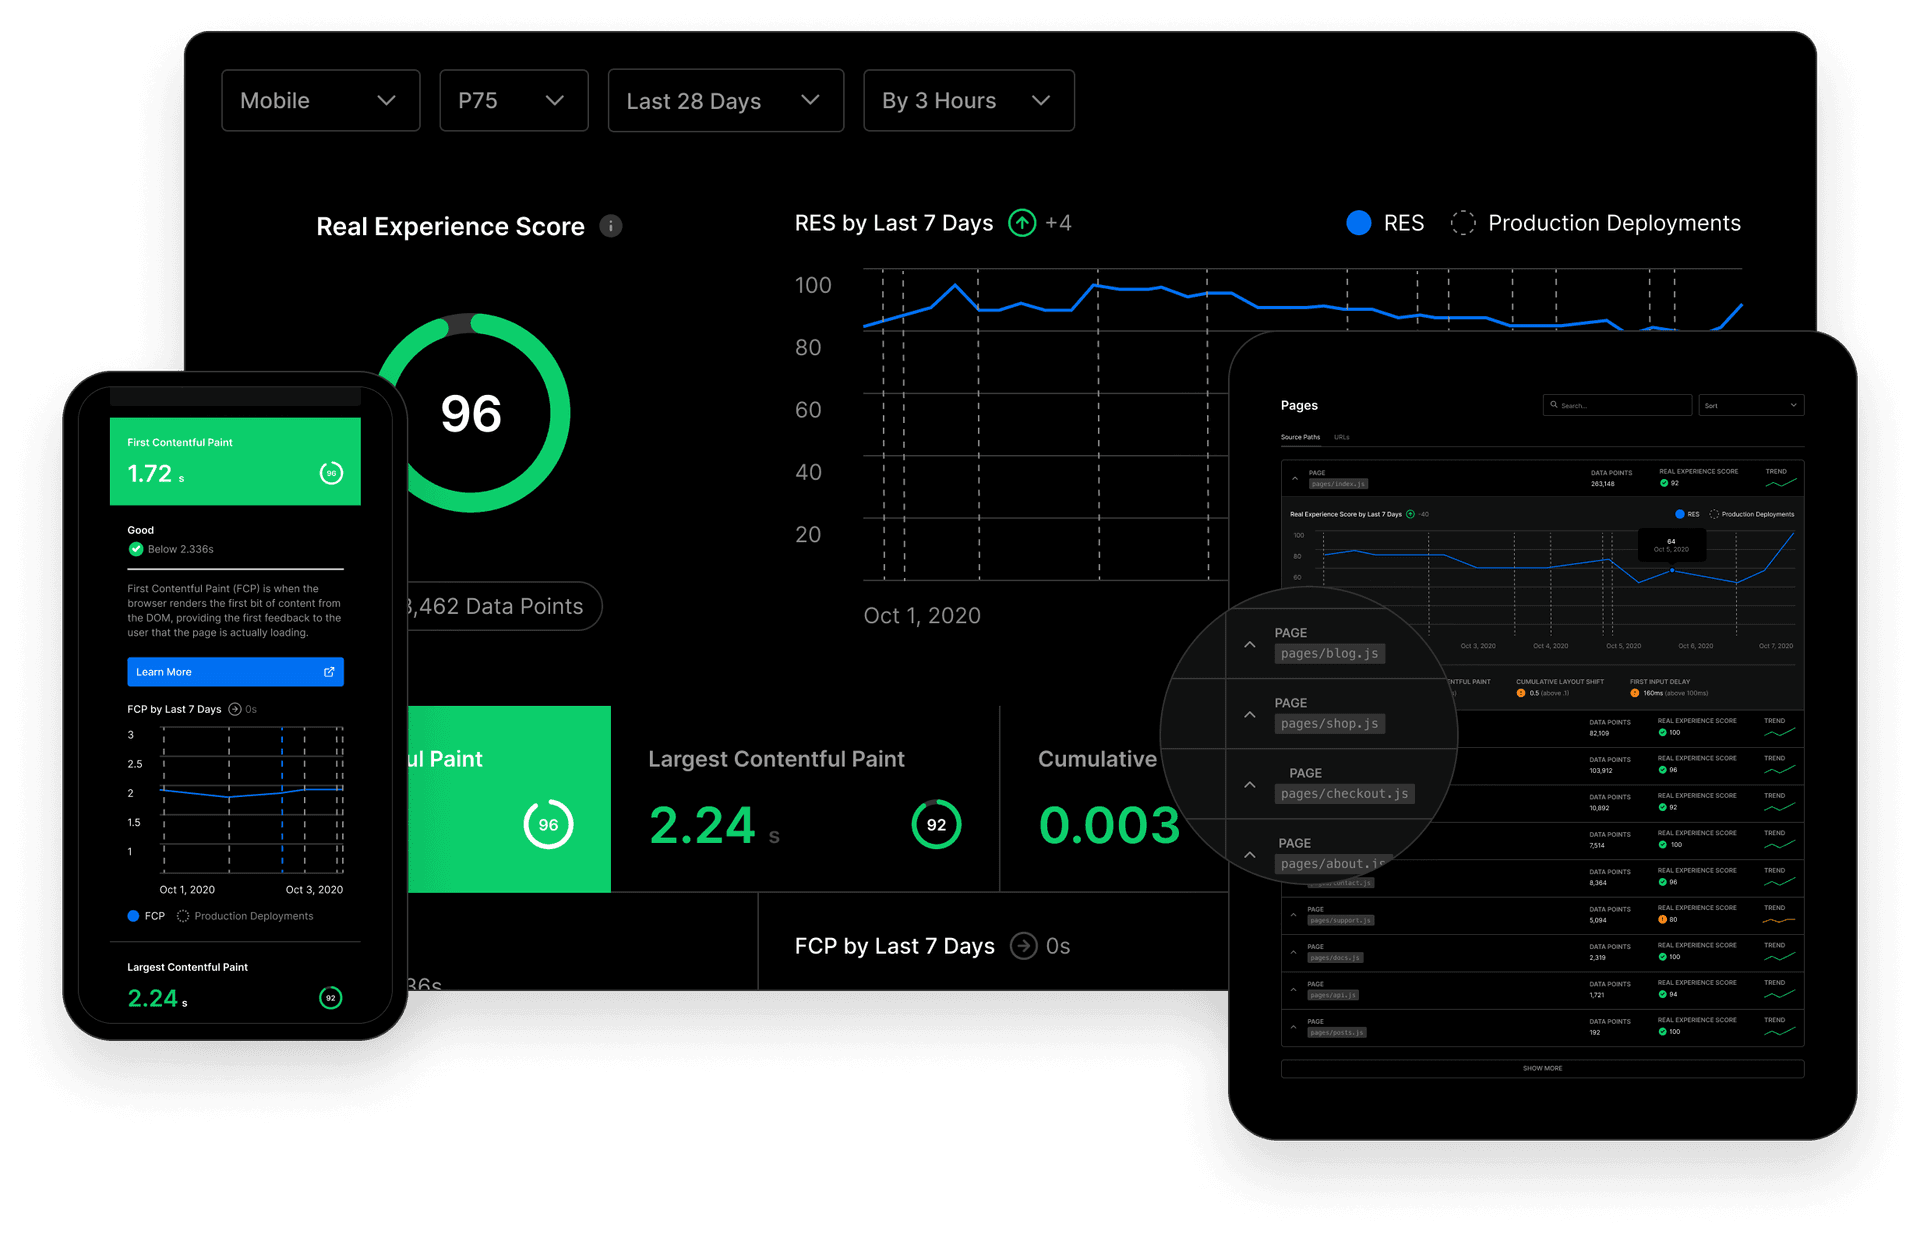


Enable Analytics today by visiting the Analytics tab in your project dashboard or try it free with a team on Vercel Pro.