7 min read
How we identify the bottlenecks that impact your bottom line.
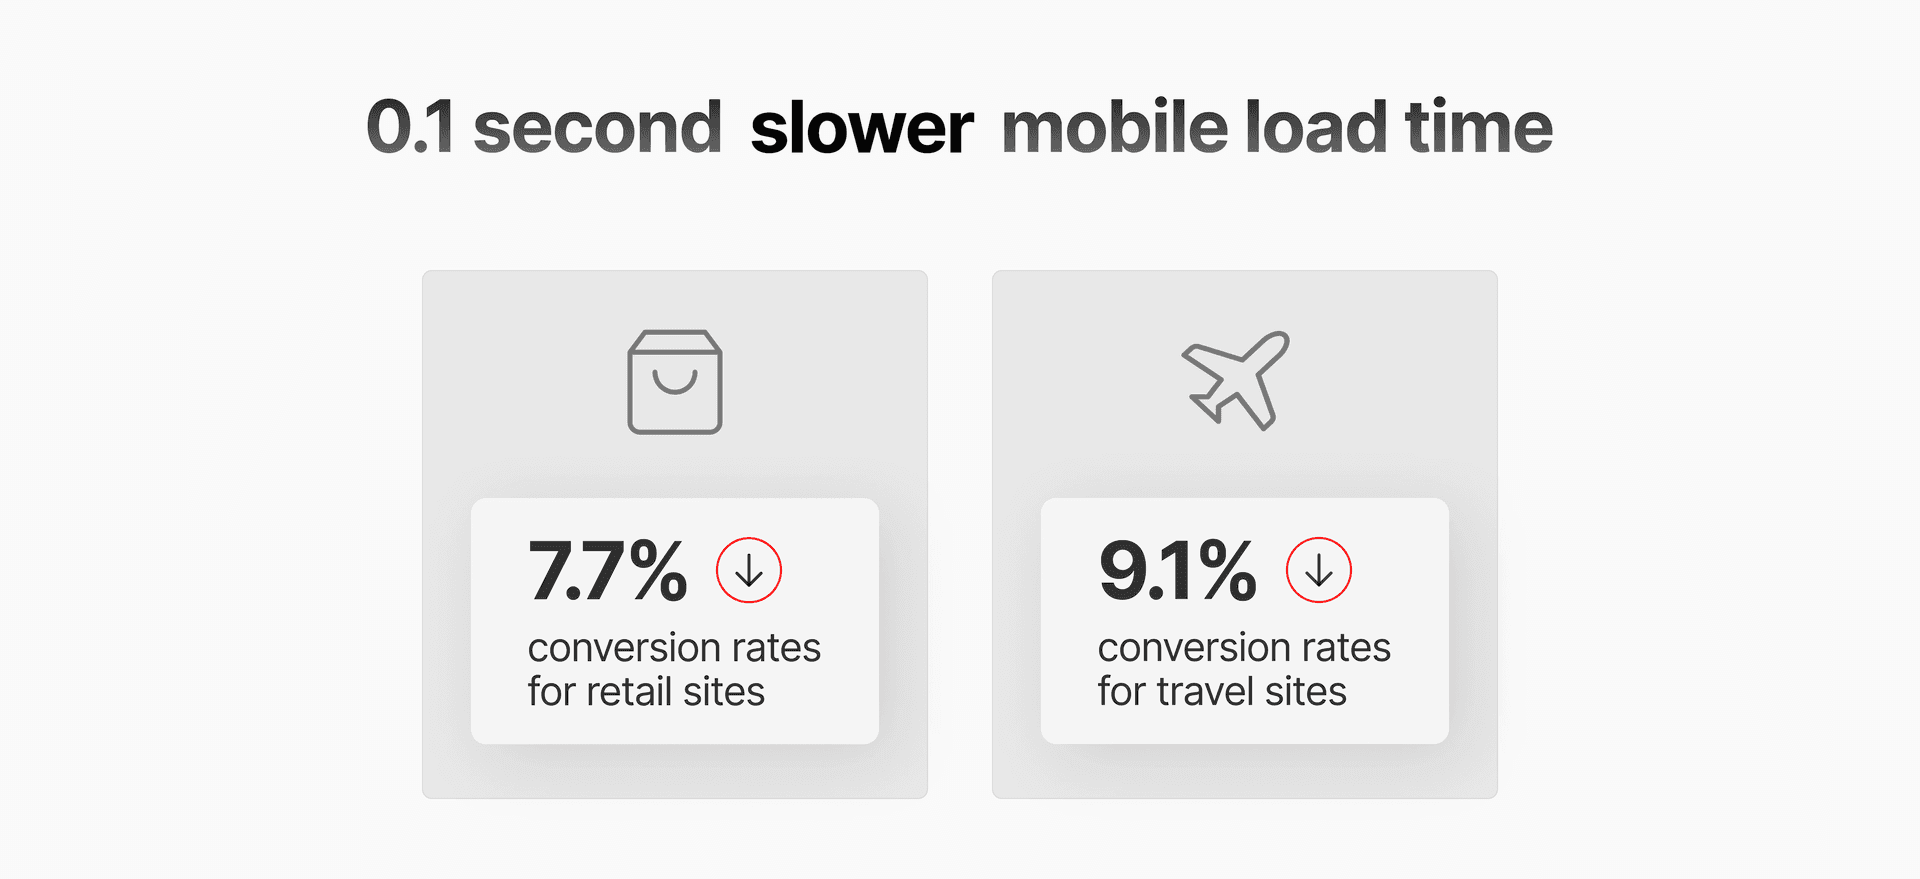
Every 100ms of latency can cost ecommerce applications up to 8% in sales conversion. At scale, this can cost millions in revenue.
Complexity compounds as applications grow, making these performance issues harder to diagnose and fix. Audits help teams navigate these challenges systematically.
This article covers strategies we've developed across hundreds of real-world audits.
Link to headingThe tipping point: When performance meets scale
Recently, one of our enterprise ecommerce customers hit a common inflection point.
Their Next.js application launched with great performance metrics, but as they added personalization features to drive engagement, complexity grew. Simple A/B testing evolved into sophisticated user recommendations and dynamic pricing, which hurt their metrics.
The impact was immediate and severe:
Time to First Byte (TTFB) jumped 300%
Conversions dropped 15%
Server costs doubled in three months
The issue wasn't technical debt or poor architecture. It was the inherent challenge of balancing static optimization with dynamic features.


Through our technical audit, we helped them keep their new features while restoring performance. This resulted in cutting TTFB by 70%, returning conversions to previous levels, and reducing server costs by 40%. Most importantly, we helped them establish patterns to maintain performance while adding new dynamic features.
Technical audits deliver the most value at specific inflection points in your application's lifecycle. Let's explore how you can identify these opportunities.
Link to headingThree types of technical audits
Link to heading1. Code Review Audits: When architecture needs validation
Code Review Audits help you optimize rendering and caching strategies during major transitions. When a large ecommerce platform needed to migrate from Pages Router to App Router, we helped them identify optimization opportunities:
React Server Components (RSC) payloads that were 3x larger than necessary
Data fetching waterfalls impacting page performance
Suboptimal caching strategies affecting performance
Our comprehensive analysis delivered:
Code and framework best practices
Framework-optimized code examples, patterns, and strategies
Prioritized and detailed action plan
A detailed migration roadmap with milestones
After following our action plan, they completed their migration 40% faster than estimated while improving key performance metrics.
Link to heading2. Web Performance Audits: When performance impacts revenue
A major retailer approached us with a problem: their conversion rates were dropping fast. While their initial analysis suggested performance issues, pinpointing the exact cause proved challenging. Our Web Performance Audit revealed three performance issues:
Third-party scripts degrading Core Web Vitals
Poor image optimization causing slow Largest Contentful Paint (LCP)
An inefficient API waterfall in key user flows
By addressing these issues head-on, we helped them get back on track:
45% faster Time to Interactive (TTI)
6% higher conversion rates
Improved Core Web Vitals across the board
Web Performance Audits are most valuable when evaluating site performance before launches, during any framework migrations, and for measuring real-world user experience.
Core Web Vitals affect search ranking.
Learn about the close relationship between Core Web Vitals and Google search ranking.
Read More
Link to heading3. Usage Audits: When scale drives costs
What works for thousands of users can break down at millions. We saw this firsthand when an enterprise customer's serverless costs increased dramatically due to inefficient async operations. Our Usage Audit pinpointed three issues:
Async waterfalls in product and category data fetching causing redundant serverless executions
Static pages regenerating too frequently due to short Incremental Static Regeneration (ISR) times
Inefficient data caching patterns causing unnecessary API calls
By implementing targeted optimizations based on real usage data, they reduced their infrastructure costs:
Serverless function executions dropped by 60% through parallel data fetching
Cache hit rates improved by extending ISR times and implementing on-demand revalidation
API calls reduced by 40% through optimized caching strategies
Usage Audits help you optimize infrastructure before costs spiral. You get clear data about how your application consumes resources, letting you make informed optimization decisions. Most importantly, they help establish patterns that maintain performance while adding new features.
Link to headingA diagnostic-first approach
Effective technical audits begin by analyzing the gap between intended goals and actual production performance, rather than starting with code review. We assess:
User experience: The application's real-world performance, identify friction points in user flows, and pinpoint where performance metrics start to degrade
Resource efficiency: How effectively the app uses platform resources, uncovers areas driving unexpected costs, and identifies usage patterns that need optimization
Development velocity: Deployment frequency and identify developer roadblocks that add friction to delivery
This analysis often surfaces key issues impacting application performance and developer productivity.
Performance bottlenecks: High TTFB, slow navigations/interactions, and redundant resource preloads
Resource waste: Overactive page generations, bandwidth spikes from unoptimized images, unoptimized RSC payloads, and inefficient Edge Middleware patterns
Developer friction: Misunderstanding of React and Next.js best practices, slow build times, and unintentional security oversights
This diagnostic-first approach ensures we target improvements that deliver the most value. Understanding the impact on business goals helps prioritize fixes effectively.
See if the time is right.
If you're struggling to identify bottlenecks in your app's performance, we can help.
Start a Conversation
Link to headingCommon patterns that impact performance
After conducting hundreds of technical audits, we've identified key patterns that consistently affect applications. Let's explore some of the most impactful ones and their solutions.
Link to headingDynamic features vs. static optimization
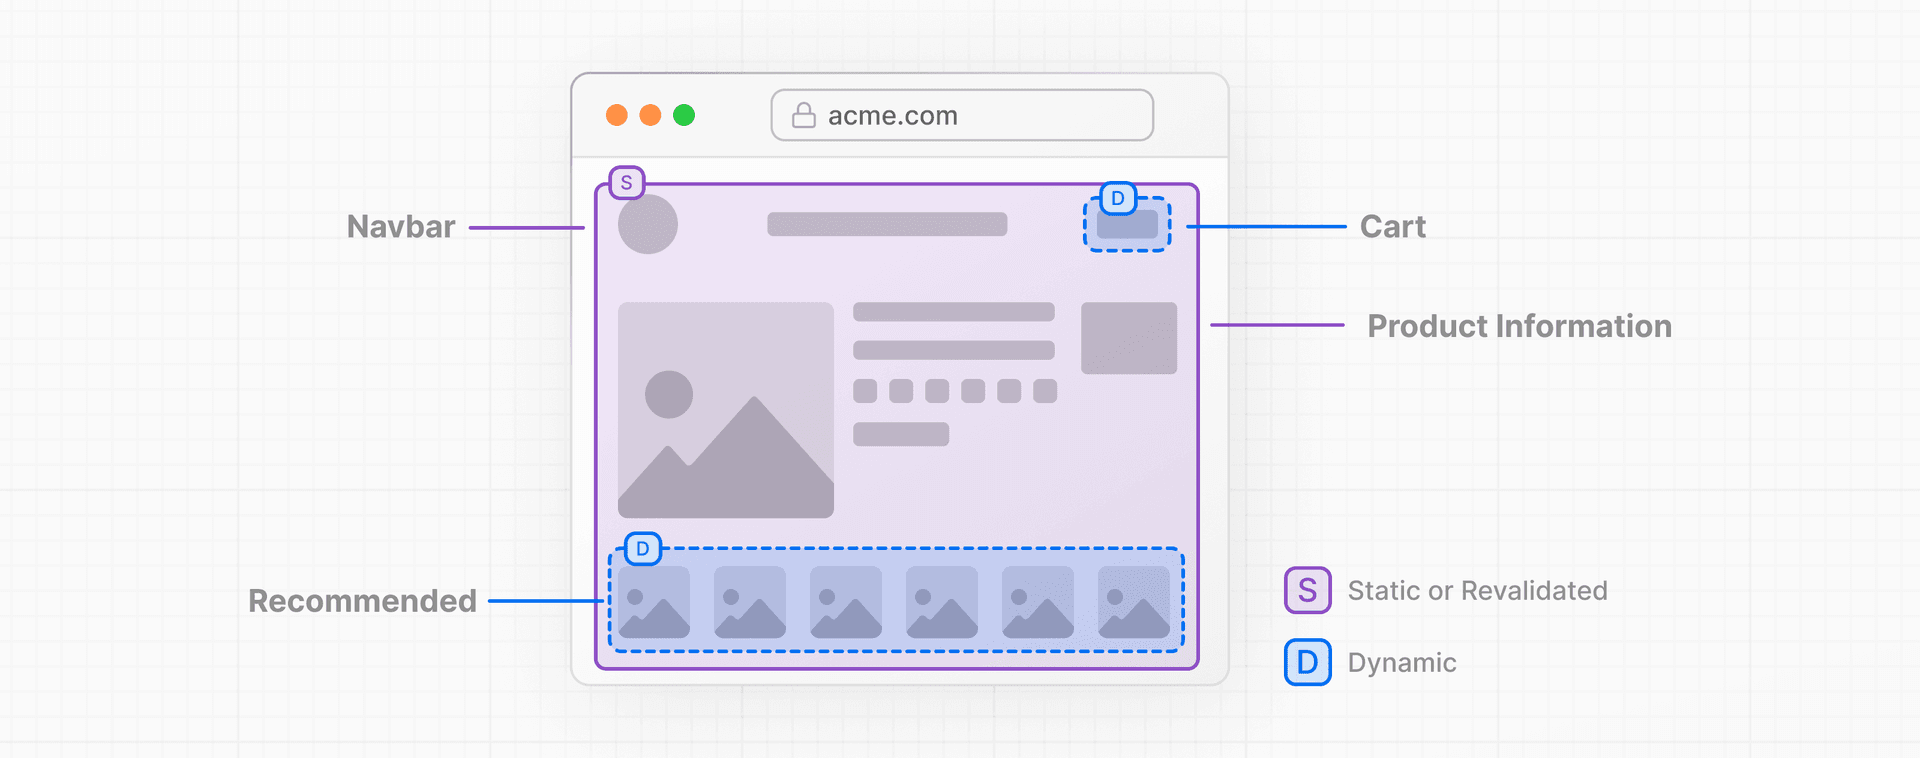
Teams often achieve great initial performance through static optimization, only to see it degrade as they add dynamic features. This pattern emerges frequently in ecommerce, where personalization, A/B testing, and inaccurate data directly impact revenue.
Negative business impact:
Misaligned rendering strategies, such as using server-side rendering (SSR) where static would suffice or missing SSR on dynamic paths
Lower conversions from slower page loads
Degraded user experience from increased TTFB
Common implementation issues:
Static optimization disabled across entire routes
Page-level data fetches that block rendering
Client-side A/B testing impacting performance
Recommended solutions:
Use Edge Middleware with ISR for auth flows
Push data fetching down to the component level, often with SWR
Move A/B testing to the server using Edge Middleware for pre-computed variants
Typical outcomes:
40-60% reduction in server costs
Return to baseline conversion rates
Significant TTFB improvements across global regions


Link to headingResource optimization
As applications scale, resource usage patterns become increasingly important. We consistently see this with serverless functions and third-party integrations, where small inefficiencies compound into significant costs.
Negative business impact:
Increased bandwidth costs from inefficient CDN configurations
Higher serverless costs that grow exponentially with increased traffic
Degraded performance in global markets
Common implementation issues:
Unoptimized images creating larger page size
Images missing width and height attributes causing layout shift
Autoplay videos loading on page load, often from the
publicfolderSequential API calls instead of parallel API calls in serverless functions
Using an additional CDN in front of Vercel's already-optimized Edge Network
Inefficient authentication patterns in middleware affecting all traffic
Dynamic routes without cache control
Inconsistent data fetching patterns across components, which can lead to redundant requests and increased load times
Recommended solutions:
Define image dimensions and use optimized image formats, which Next.js's Image component can help enforce and serve automatically
Load video content via blob storage or CDN with lazy loading and/or chunked streaming
Establish consistent and parallel data fetching patterns
Implement efficient authentication patterns across edge middleware, components, and API endpoints and target specific routes
Add strategic caching to minimize function calls
Typical outcomes:
30-40% reduction in bandwidth usage
50% fewer serverless function executions
90% cache hit rates globally


Link to headingMigrating from Pages Router to App Router
The transition to Next.js App Router unlocks powerful new capabilities, but requires careful planning and a change in patterns.
Negative business impact:
Delayed feature delivery during extended migrations
Higher resource costs from inefficient patterns
Performance drops affecting user experience and revenue
Common implementation issues:
Oversized RSC payloads sending unnecessary data to clients
Incorrect client/server component boundaries causing excess client-side JavaScript
Missing cache configurations in data fetching
Props passing entire objects between server/client boundaries instead of specific fields, causing unnecessary re-rendering
Legacy patterns, such as not relocating asynchronous functions to the server, blocking static optimization
Recommended solutions:
Incrementally migrate from Pages Router to App Router instead of all at once (you can use both in Next.js at the same time)
Profile RSC payload size using Chrome DevTools and minimize where possible
Use Suspense boundaries for effective client/server rendering
Implement granular caching with
use cache,revalidatePath, andrevalidateTagUse
React.cache()and Suspense boundaries to manage complex calls more effectively
Typical outcomes:
40% faster migration completion
50% reduction in client-side JavaScript
Improved Core Web Vitals across all metrics
Link to headingDevelopment experience improvements
Improving developer velocity means your users get new features faster and your developers can ship fixes quickly, resulting in a better experience for everyone.
Negative business impact:
Extended build times blocking rapid iteration
Inability to address critical issues during crucial business times (like Black Friday-Cyber Monday)
Technical debt compounding over time
Common implementation issues:
Unoptimized Next.js configurations causing slow builds, particularly from missing bytecode caching
Inefficient module imports
Trade-offs between DX and performance
Excessive use of third-party libraries, which can weigh down local development
Recommended solutions:
Optimize build configurations for your use case
Avoiding barrel files for better bundle times and smaller client-side JavaScript
Balance developer experience with performance needs
Audit and remove any unnecessary third-party code
Typical outcomes:
Build times cut in half
Bundle size reduced by 33%
Measurable increase in deployment frequency
Link to headingBuilding sustainable patterns
Technical audits work best as catalysts for sustainable improvement, not one-time fixes. They provide value at every stage of your application's lifecycle—before, during, and after major migrations. The goal is to establish patterns that help you build better applications for the long term.
While audits can help identify optimization opportunities during migrations, comprehensive migration support is available through our additional consulting services. This includes guidance for monolith-to-headless transitions and framework migrations.
To help you implement our recommendations effectively, each audit includes four 30-minute weekly office hours sessions. During these sessions, our experts can answer questions and provide guidance on implementing audit recommendations.
Let us know how we can help
Whether you're starting a migration, need help optimizing, or want to add AI to your apps and workflows, we're here to partner with you.
Contact Us