2 min read
Visualize, diagnose, and optimize your sites.
We’re excited to share some new additions to our observability suite: Monitoring, now generally available for Pro and Enterprise teams and Logs for users on all plans. These tools give teams on Vercel the ability to quickly identify and resolve issues before they become major problems with an aggregated view of web traffic and performance data.
Link to headingWhy Vercel Monitoring?
With Vercel's new Monitoring functionality, access realtime insights to quickly identify production issues, and accelerate your ability to enhance and optimize the performance of your web applications.
With the ability to track and analyze the performance of different parts of your site in the Vercel dashboard, easily identify bottlenecks and make data-driven decisions about how to up-level the performance of your web applications, improve costs, and mitigate errors.
Link to headingData at your fingertips
Vercel gives you and your team detailed insights into your application performance and the ability to drill-down with Logs. Access a range of example queries right in your dashboard that help you quickly identify issues, such as:
Bandwidth and web traffic spikes
Performance degradation on a request path
500 errors due to a specific deployment
With these metrics at your fingertips you can identify and fix issues before your customers even notice.
We were able to use the Monitoring functionality in Vercel to quickly detect which bots were causing our issues and troubleshoot from there.
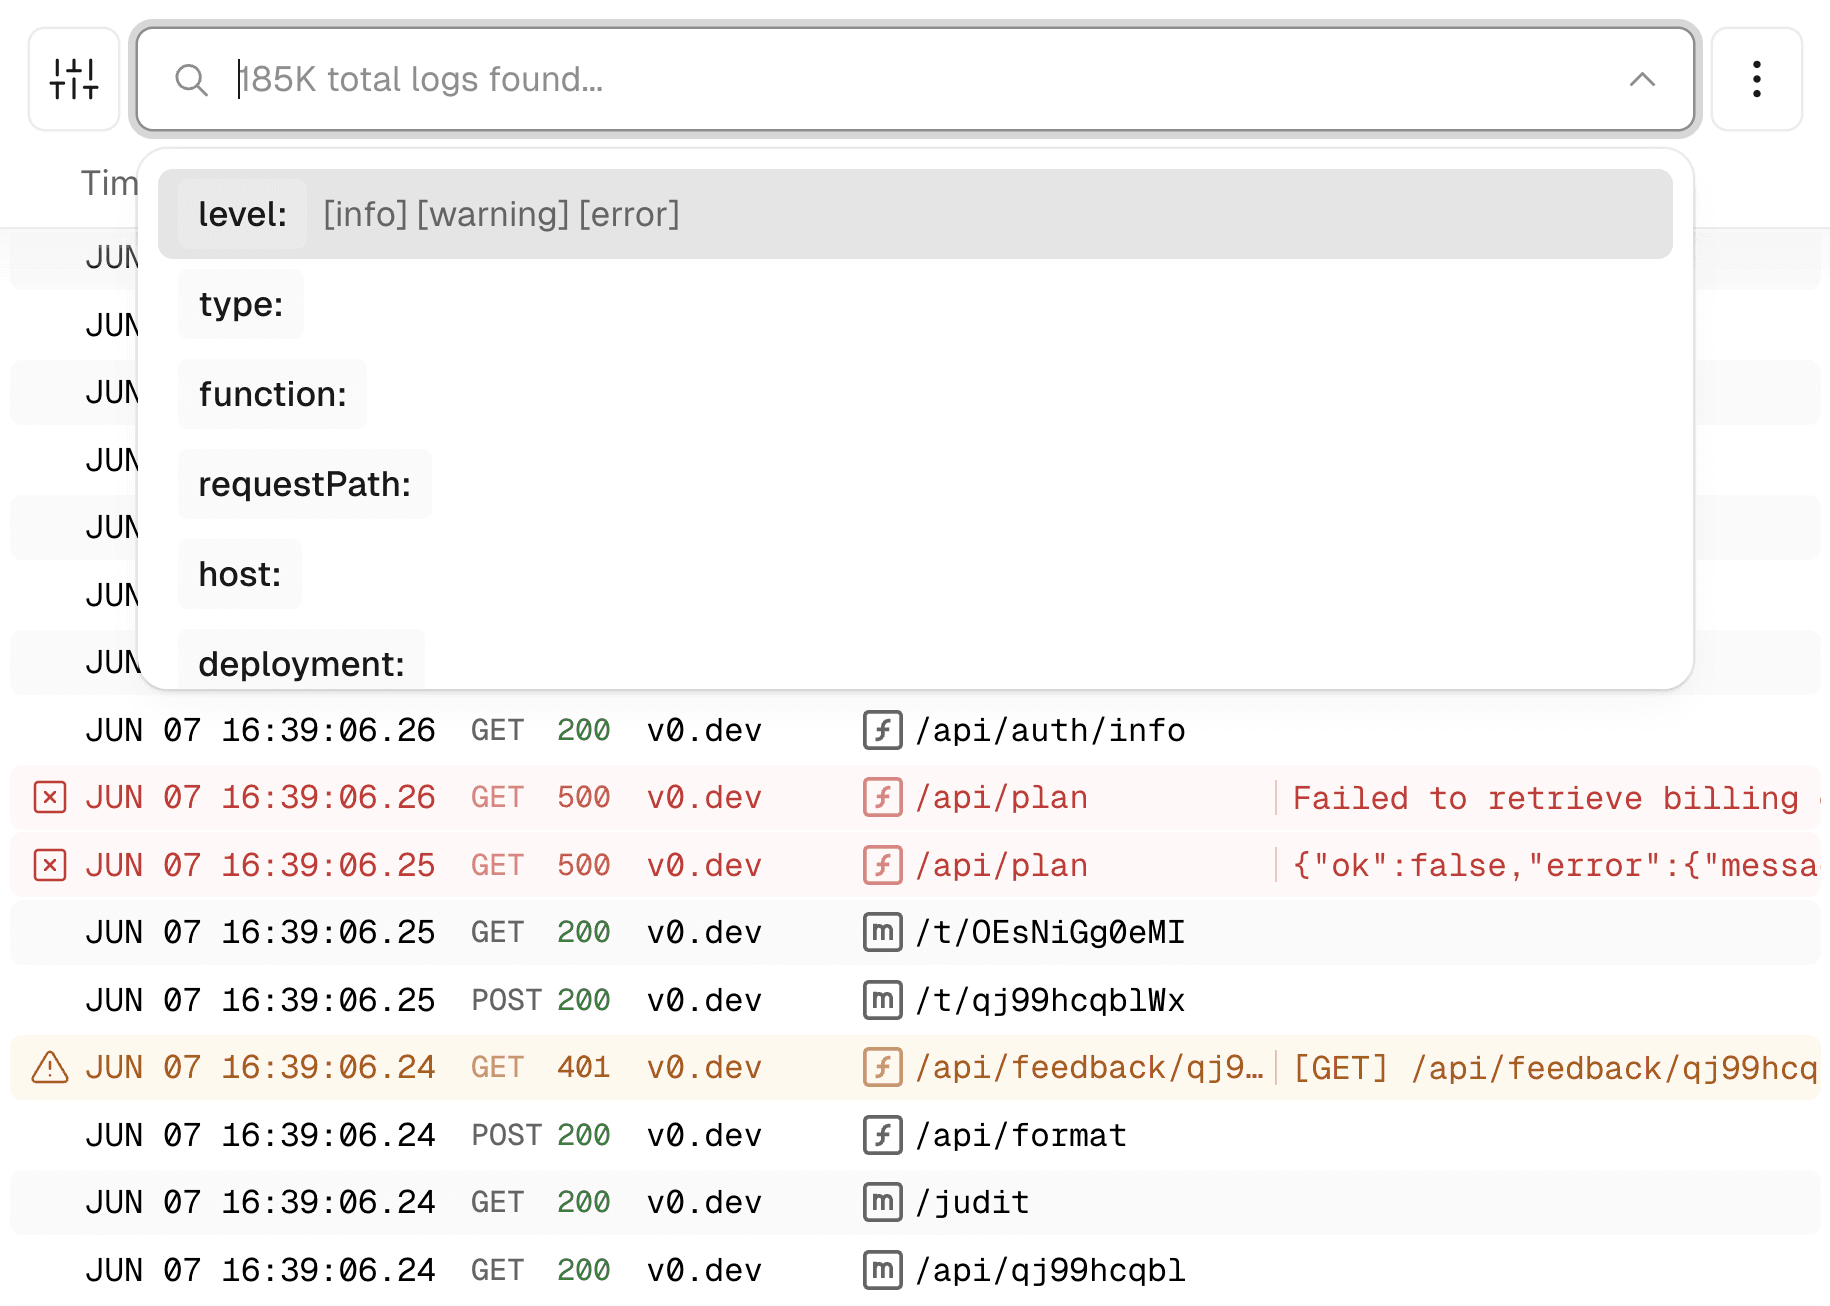
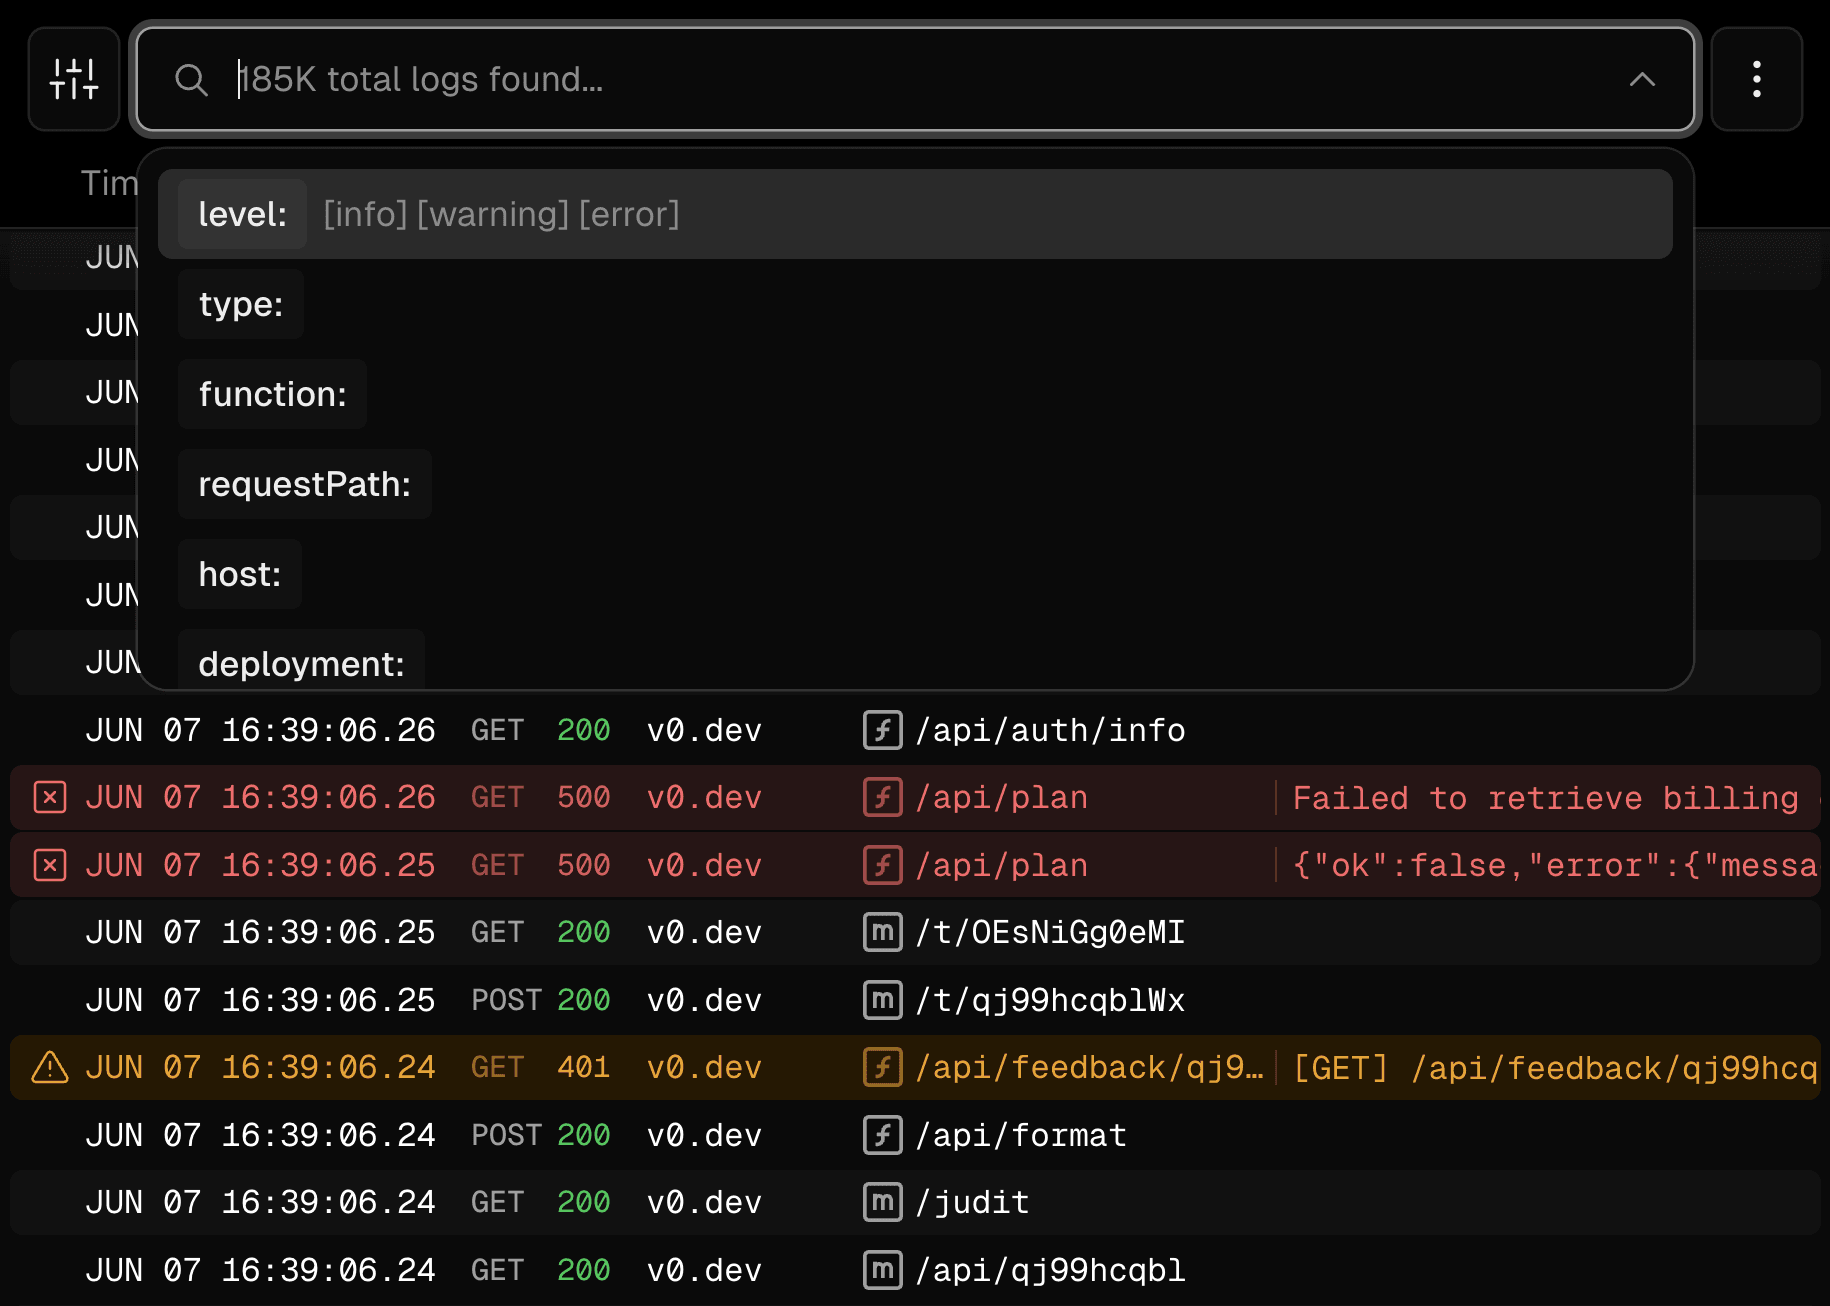
The new Logs allow you to drill-down into errors and issues once they’ve been identified on production or pre-production on Preview Deployments. And additionally, you can see past Logs by default to understand your history without having to reproduce issues. With these tools, you can quickly identify the root cause of persistent errors and customer issues, minimizing downtime and improving the overall performance of web applications.


Create custom queries to gain greater, personalized insights into your data, further allowing your team to more efficiently debug issues and get proactive about optimizing projects. Or, easily integrate Vercel's tooling with your third-party monitoring tool with our enhanced Log Drain capabilities.
With this suite of tools, get detailed insights into your application performance that work for you. Learn more about pricing for Monitoring.
If you’re on a Pro or Enterprise plan you can get started with Monitoring today in the dashboard or check out the documentation.