1 min read


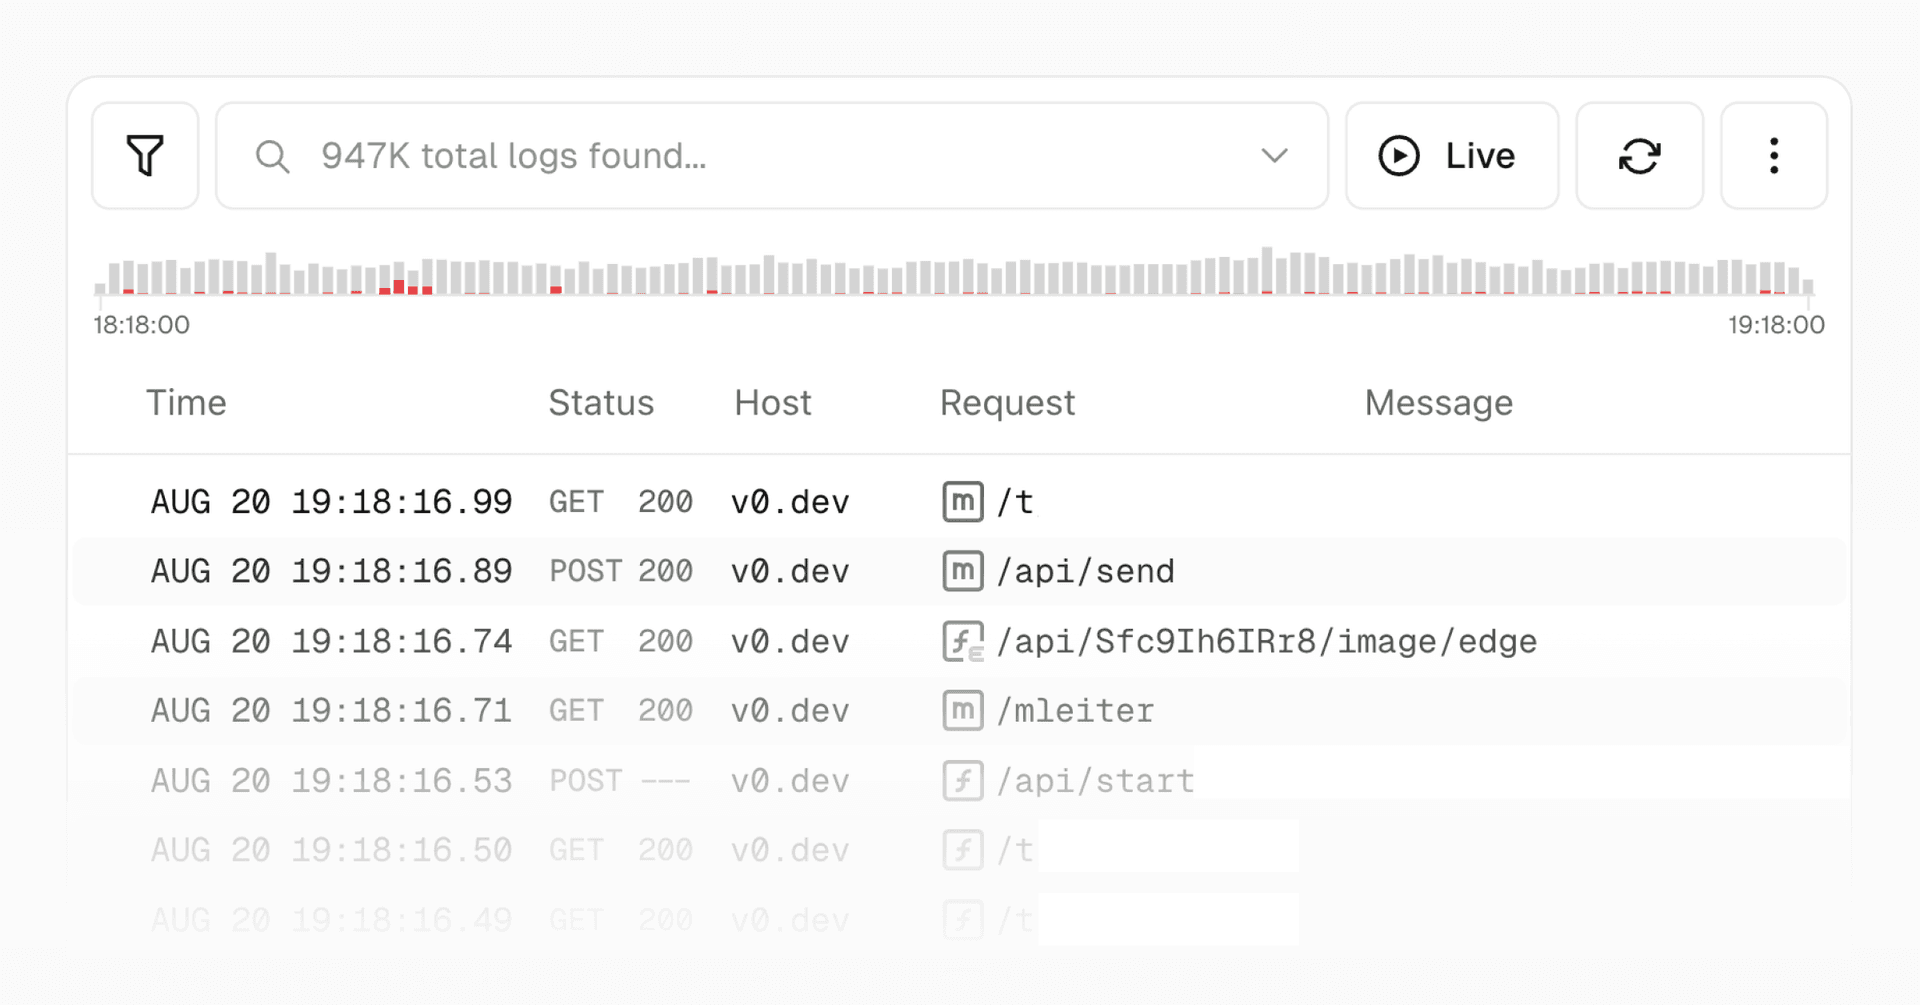
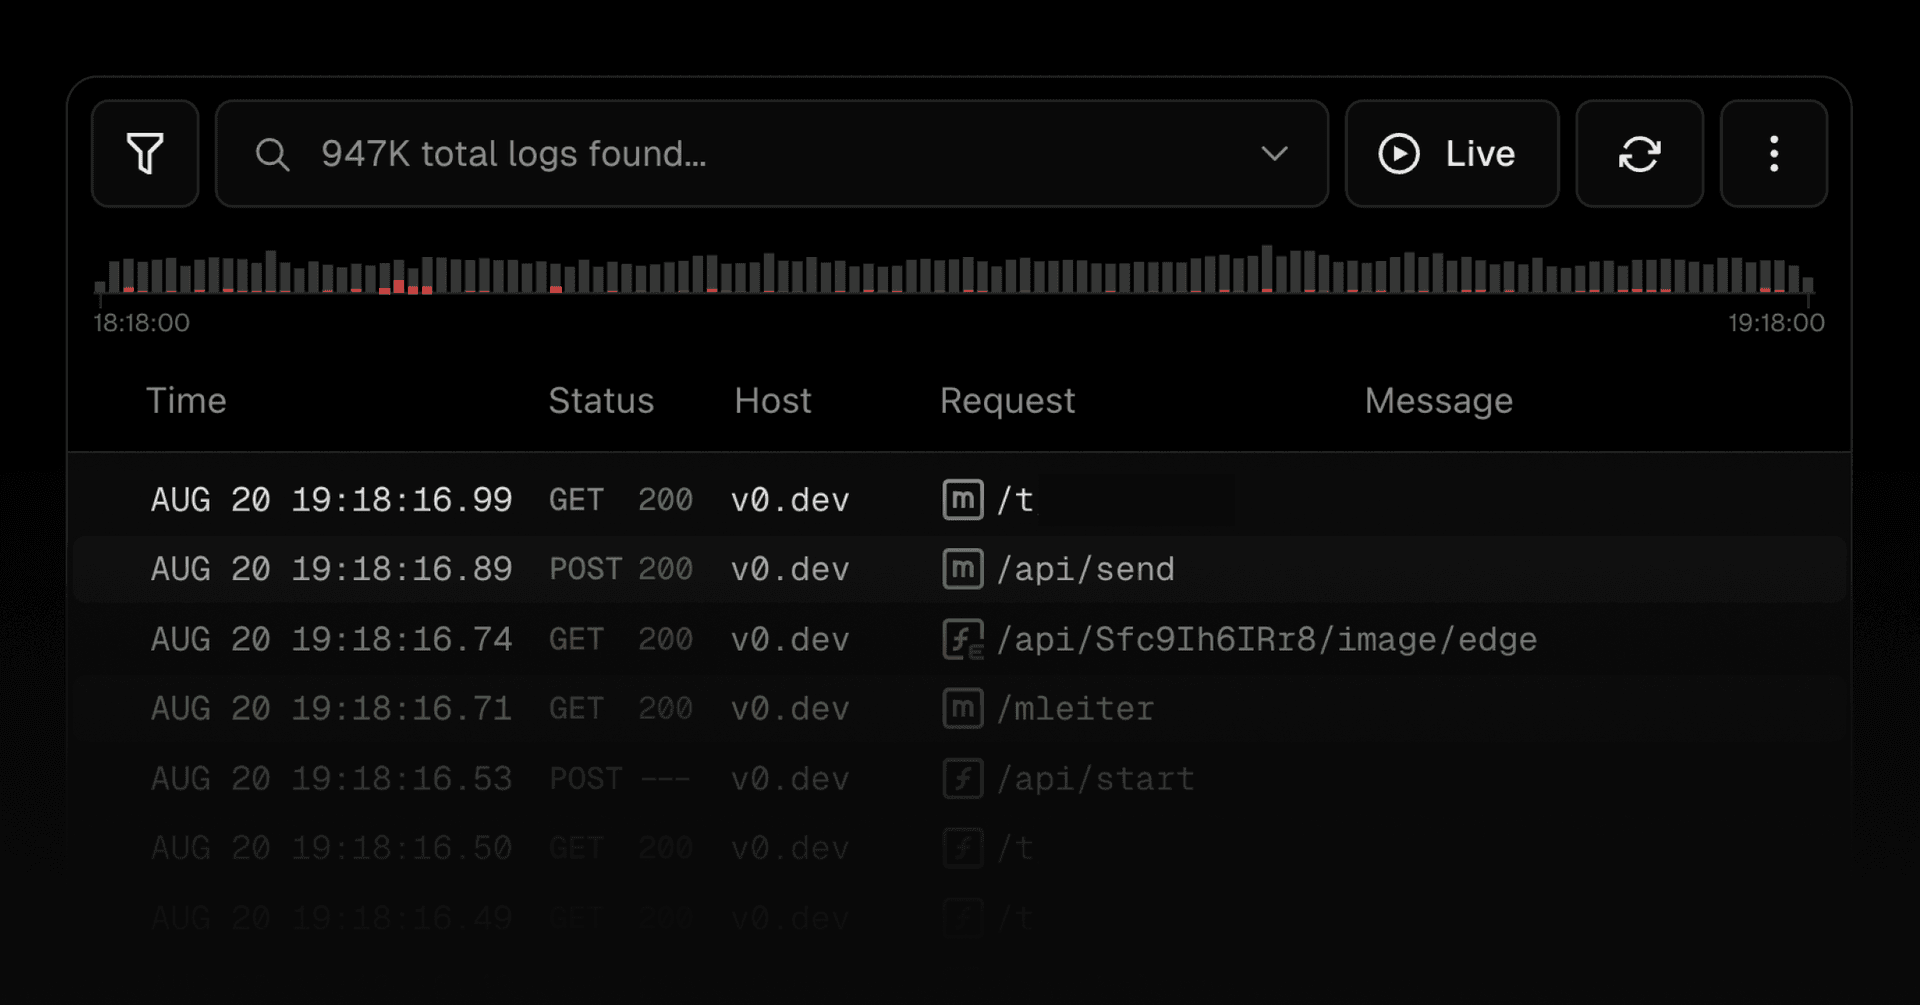
You can now visualize Runtime Logs with a time series chart.
Observe the distribution of info, warning, and error logs over time
Analyze and understand your application's behavior more effectively
Use the drag-to-select feature to filter logs for specific time ranges
Learn more about Runtime Logs.