1 min read


You can now select an aggregation when analyzing data in Vercel Monitoring. This change provides more visibility to make it easier to analyze your application.
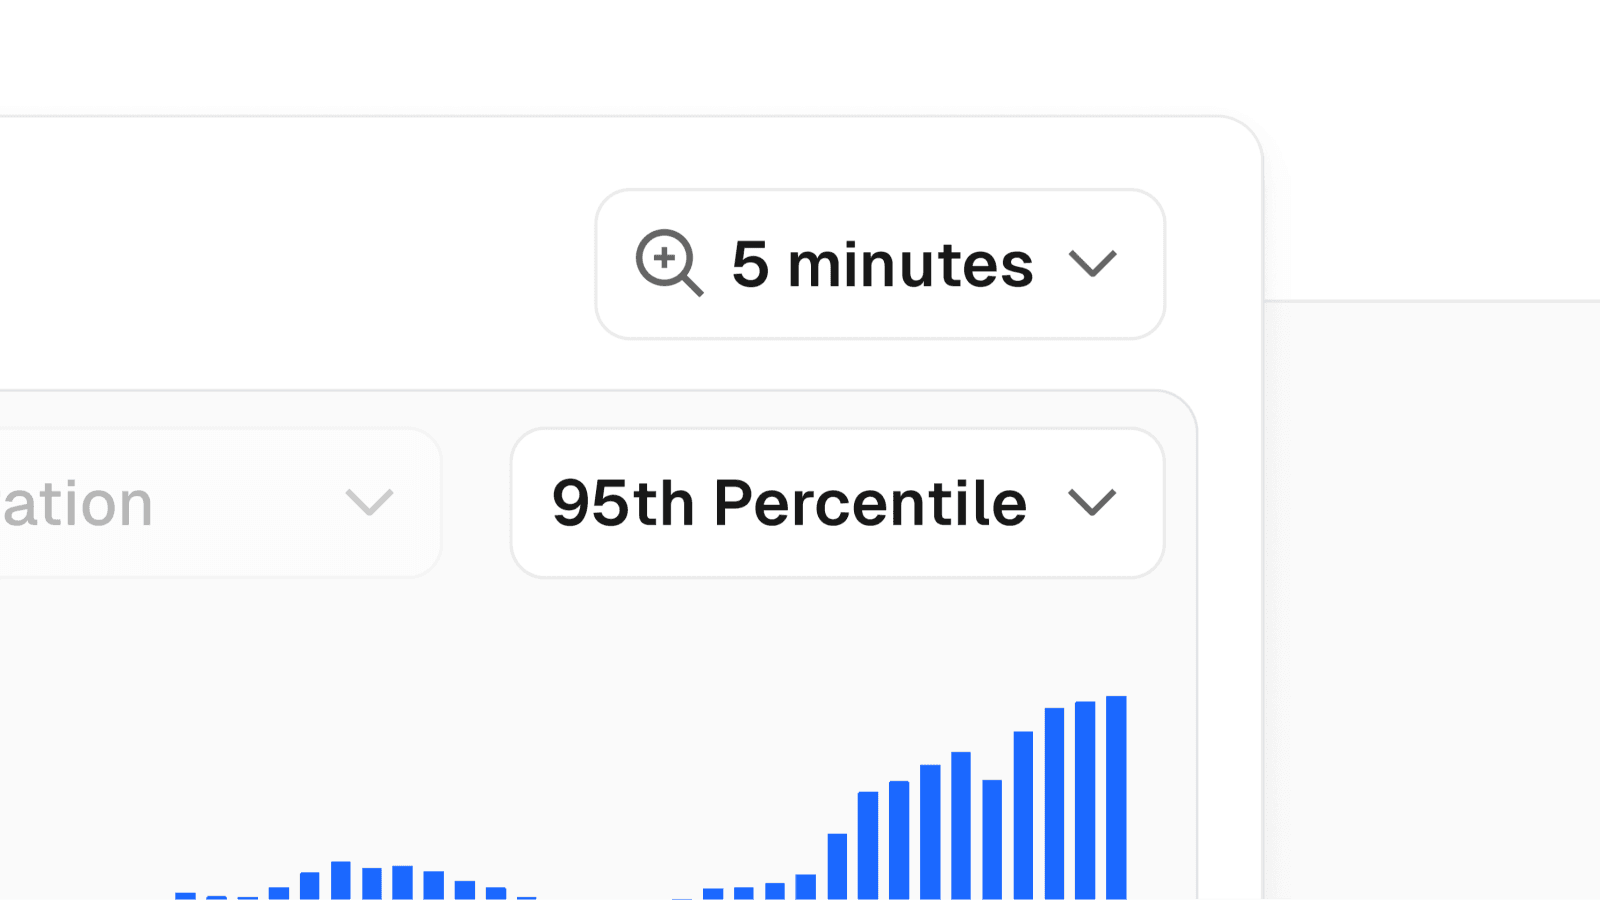
The following new aggregations are now available, in addition to sums and counts.
Average values
Per second sums and counts
Minimum and maximum values
75th, 90th, 95th and 99th percentiles
Percentages of the overall values
These aggregations can be used with any visualize setting, for analyzing data transfer, function duration, function execution, and request counts. Enterprise customers can also access data with a five minute granularity when viewing 24 hours of data or less.
Learn more in our documentation about Monitoring.