4 min read
This year, we built a Black Friday-Cyber Monday (BFCM) dashboard to celebrate the success of our customers through the busy retail weekend. The dashboard gave a real-time look inside Vercel's infrastructure, showing live metrics for deployments, requests, blocked traffic, and more.
Building a data-heavy, real-time dashboard with a good user experience comes with challenges. Let's walk through how we overcame them.
Link to headingDashboard architecture
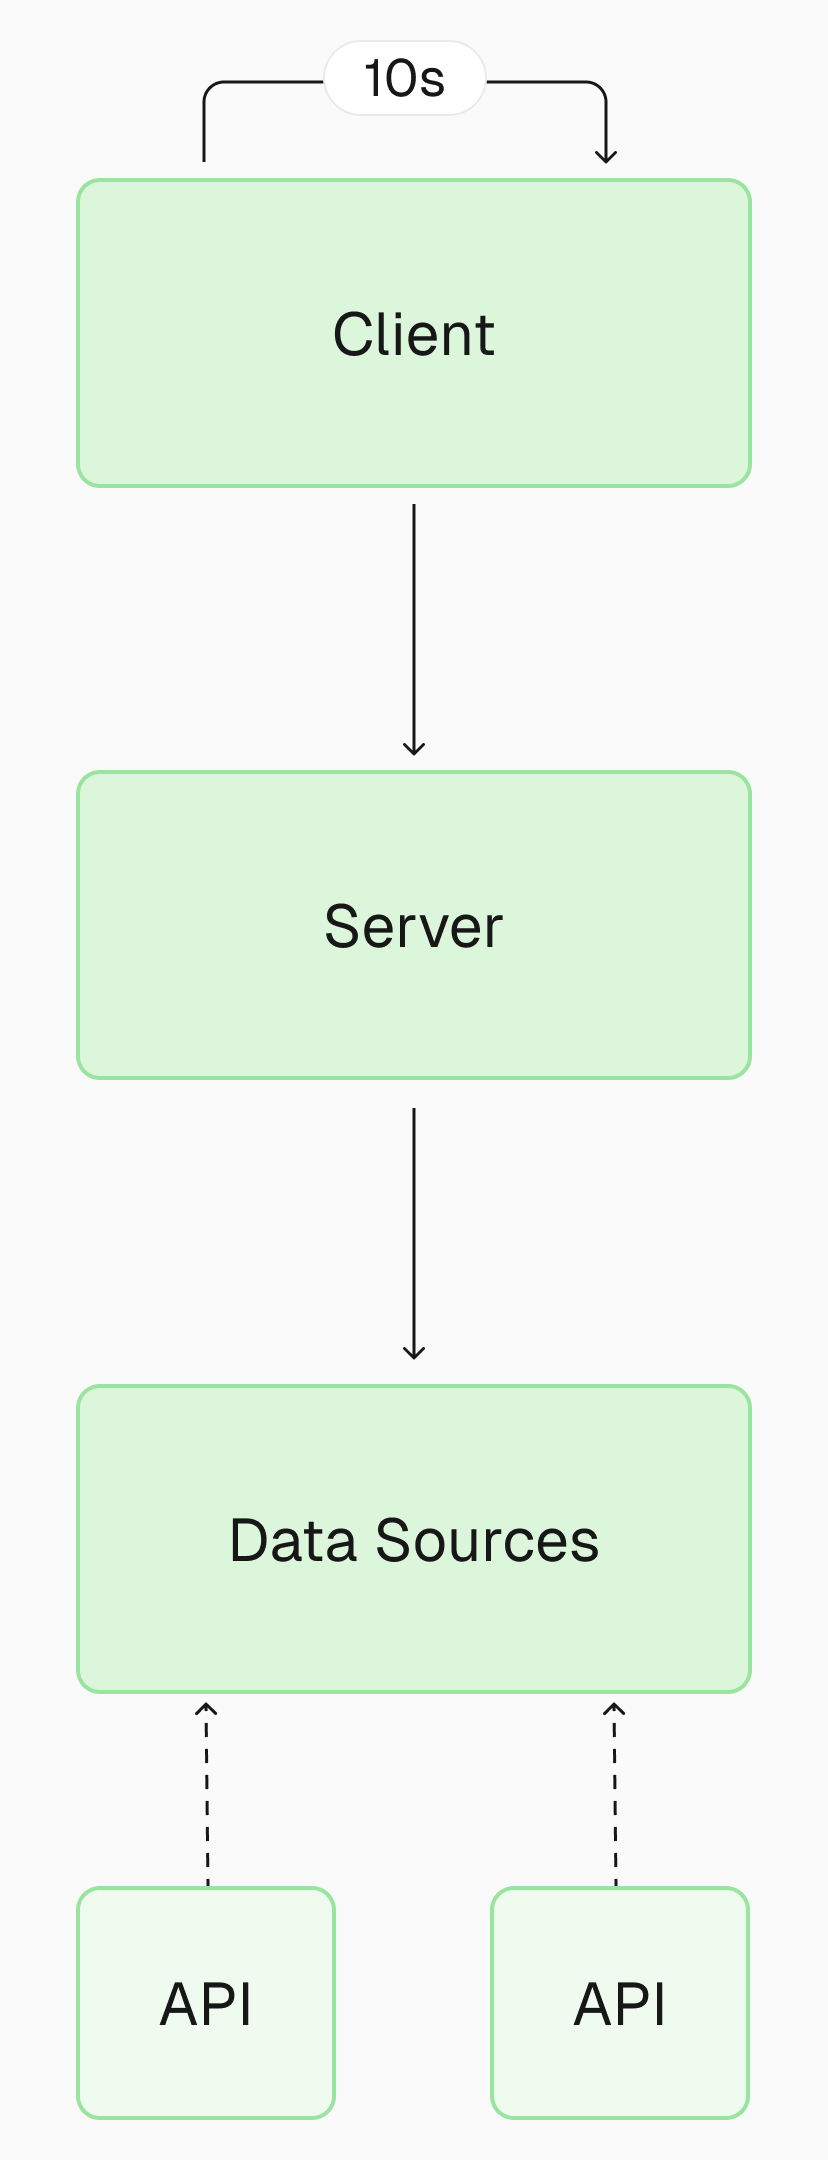
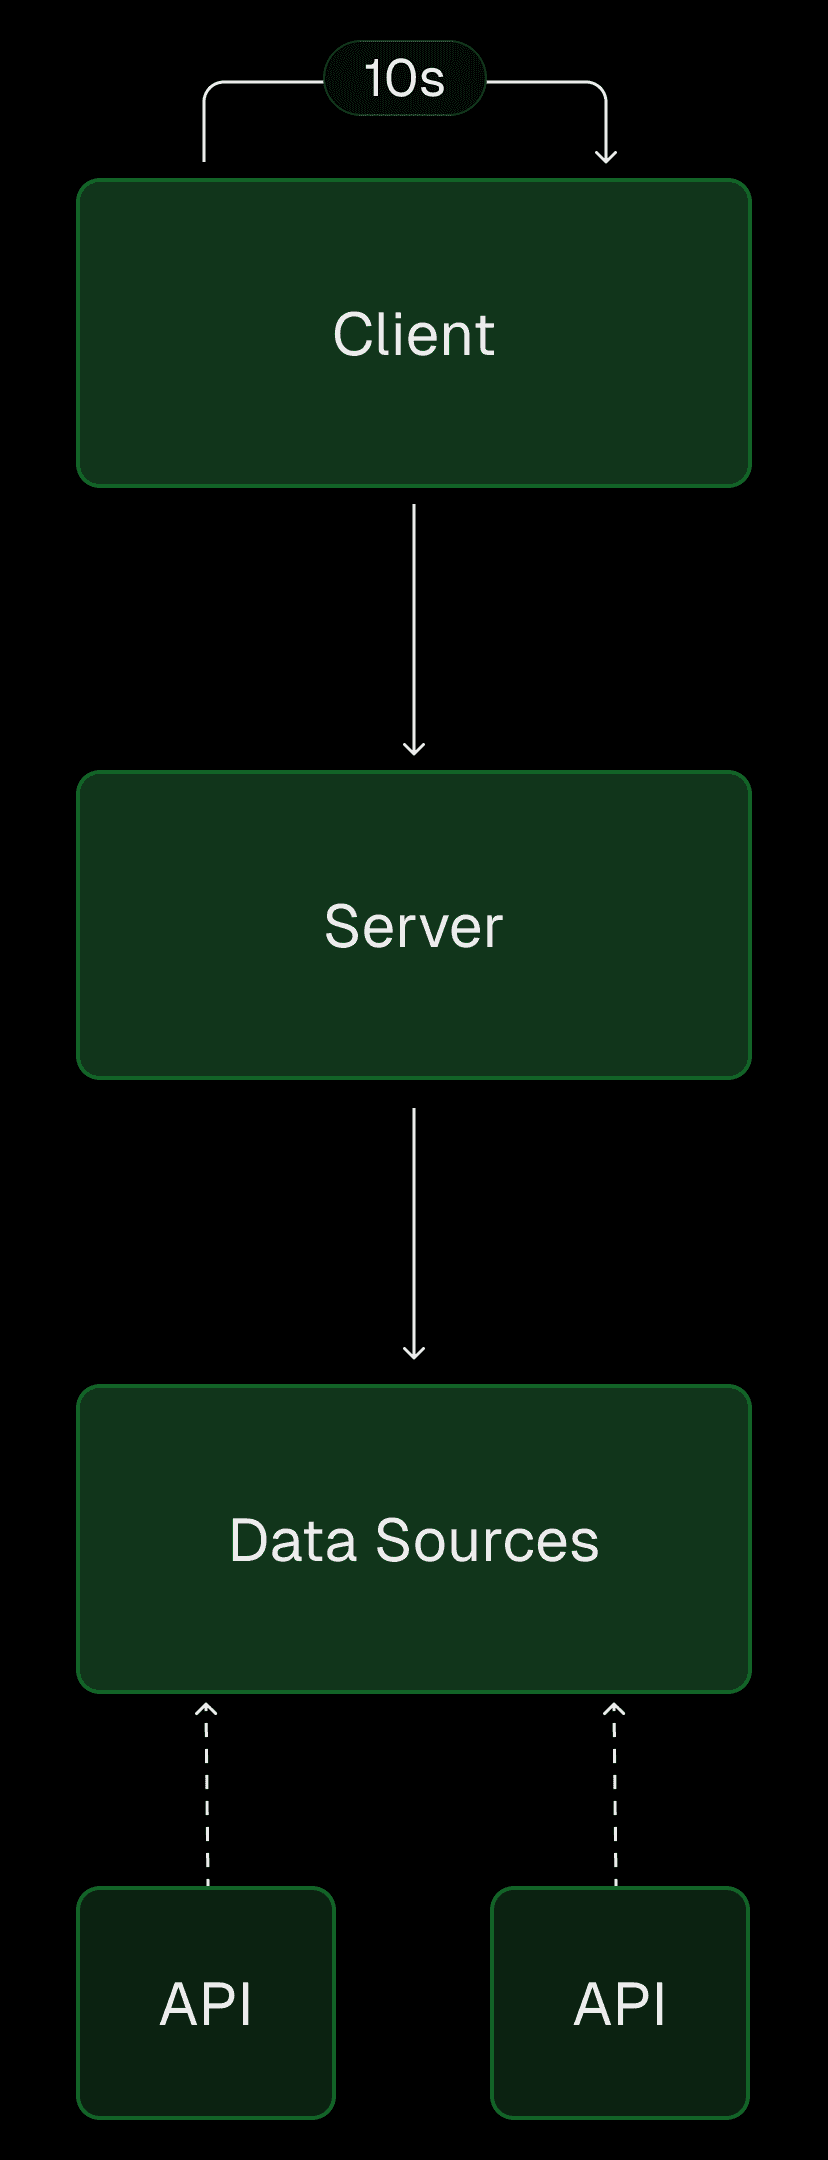
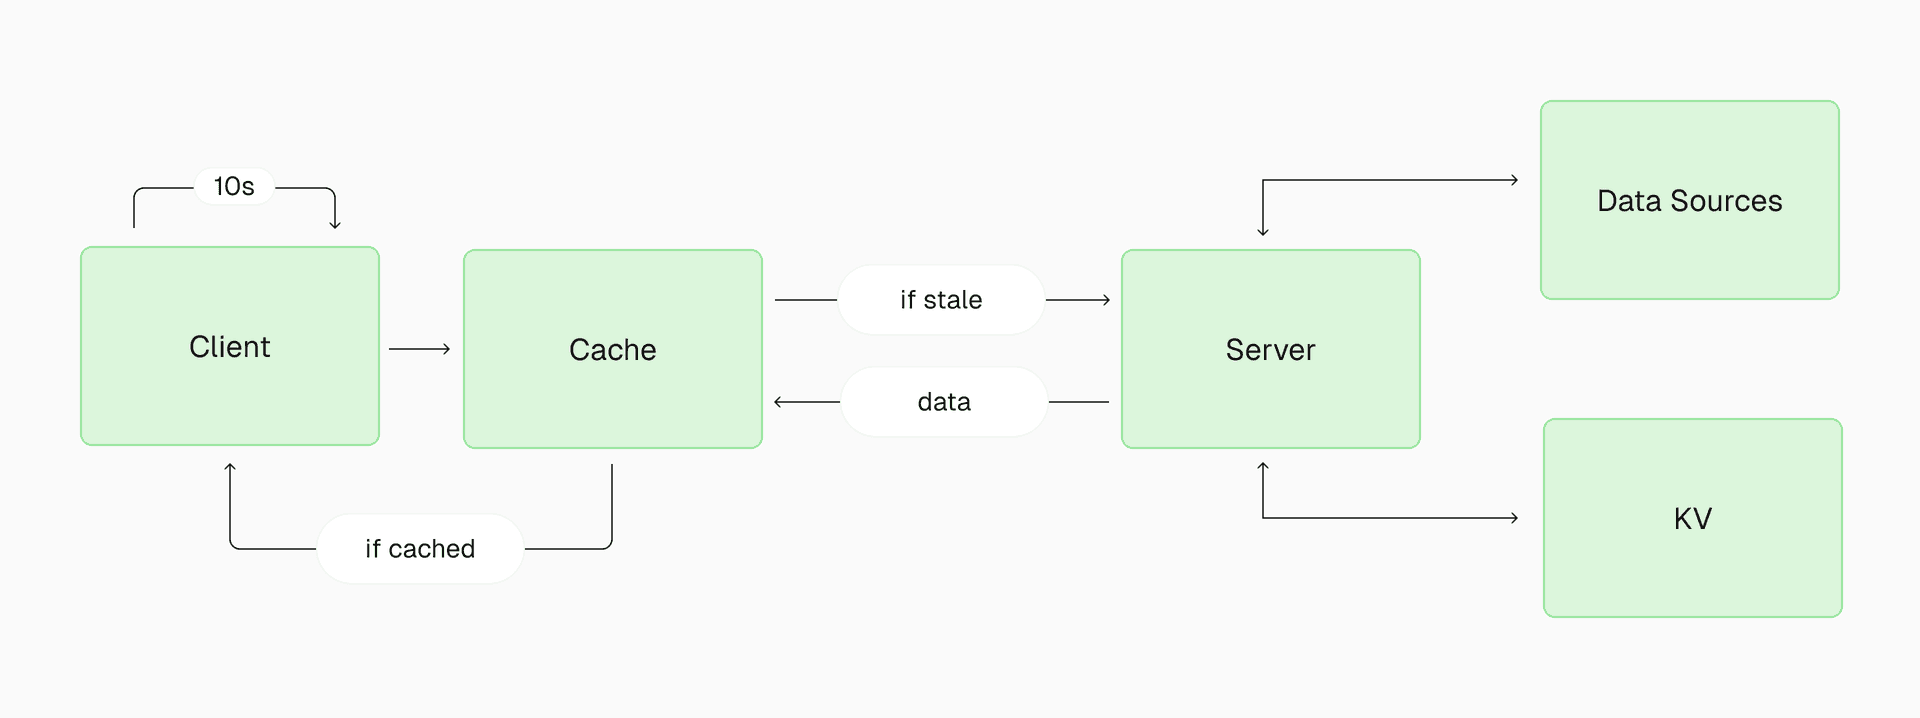
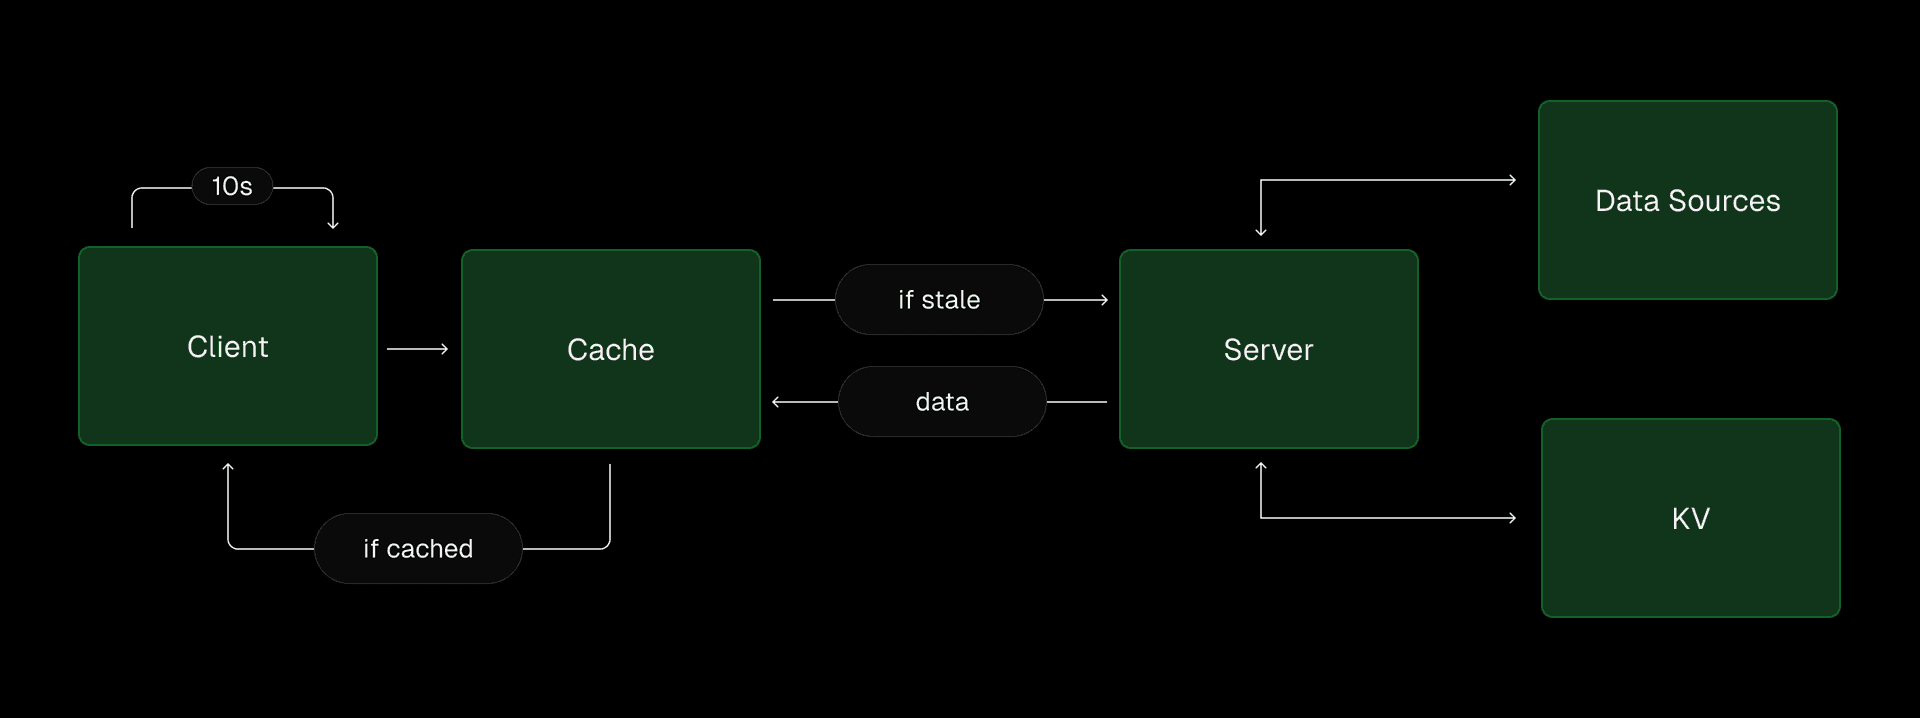
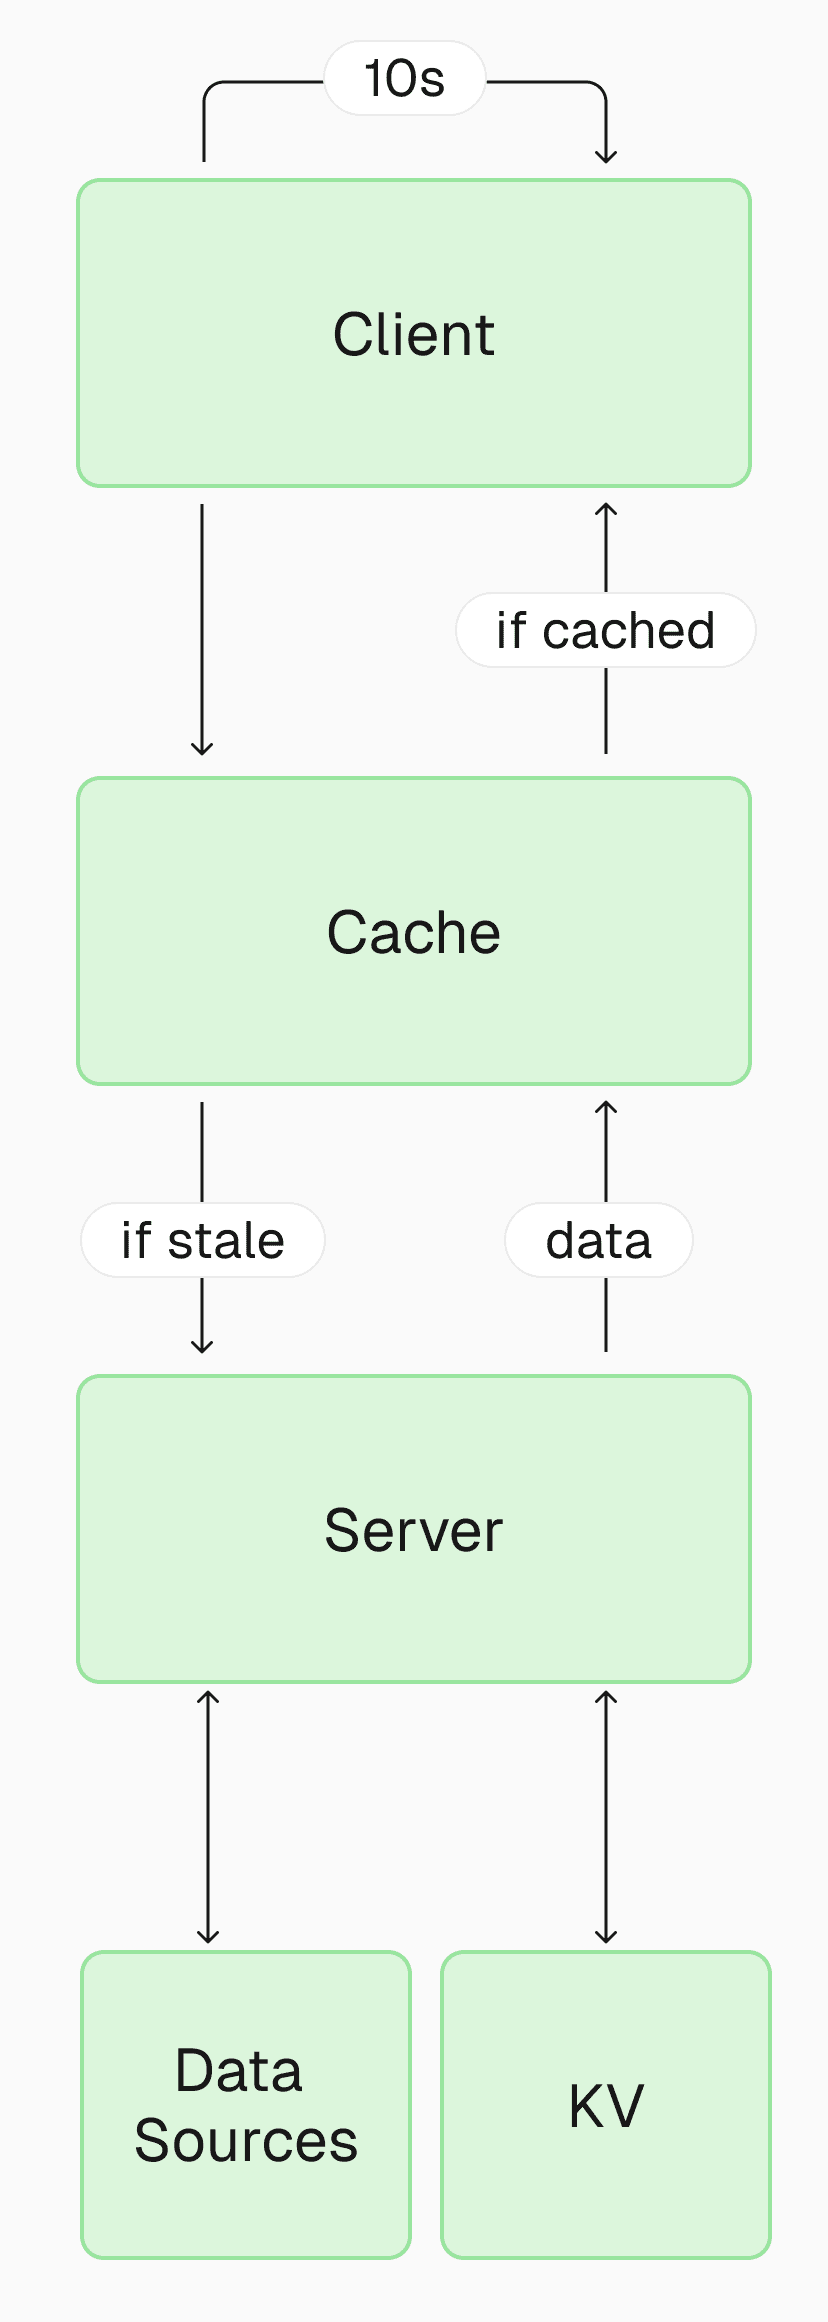
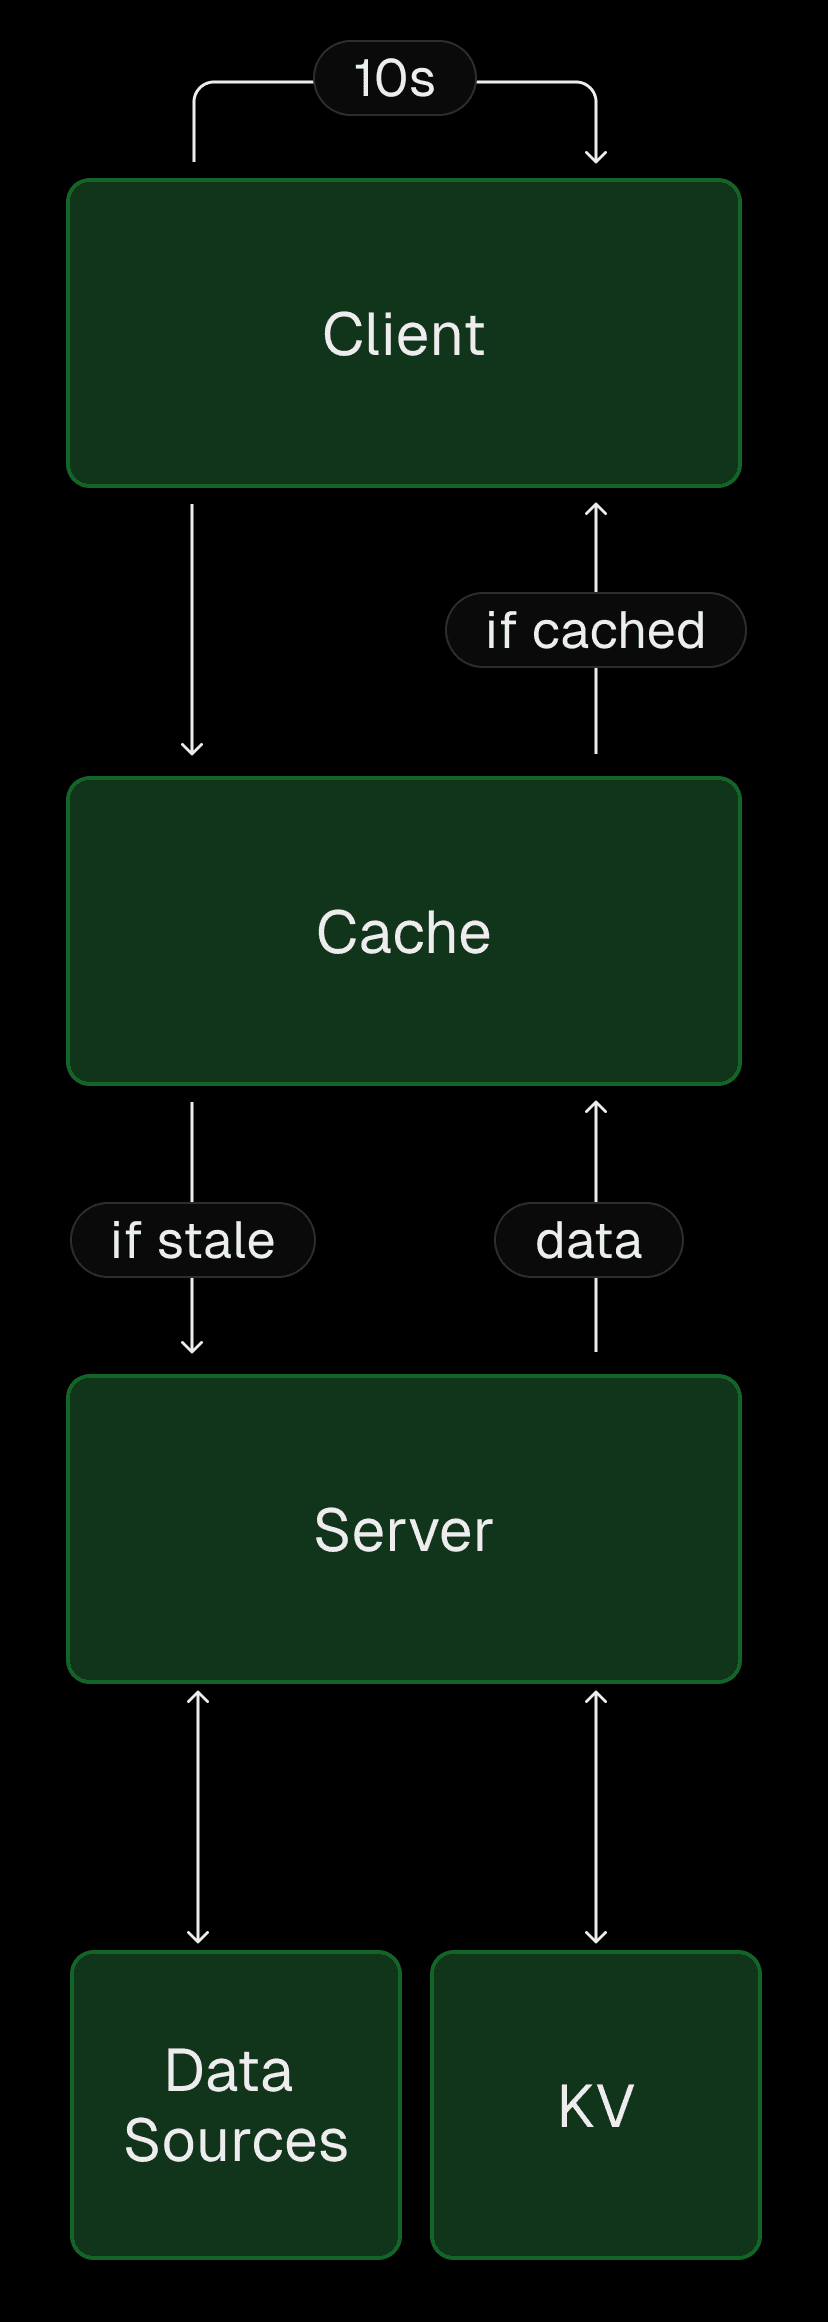
The BFCM dashboard is a Next.js application built using a modified polling architecture. The core of the site works by having the client poll the server for data every 10 seconds.
Upon receiving the request, the server queries our internal database and returns the aggregate metrics to the client. Behind the scenes, our APIs and services stream data about our requests, deployments, and the Vercel Firewall into the database.


Link to headingBackend optimizations
The metrics we wanted to highlight involved scanning terabytes of data. We needed to avoid costly long-running queries and a poor user experience while retrieving data.
Link to headingCost-efficiency: Handling expensive queries with a Vercel Marketplace Integration
We started with this initial query for getting the total requests count:
SELECT count() FROM requests WHERE timestamp > '2024-11-29 00:00:00'Initial SQL Query
Issues with this query became clear quickly. As more requests came in, the query took longer to run.
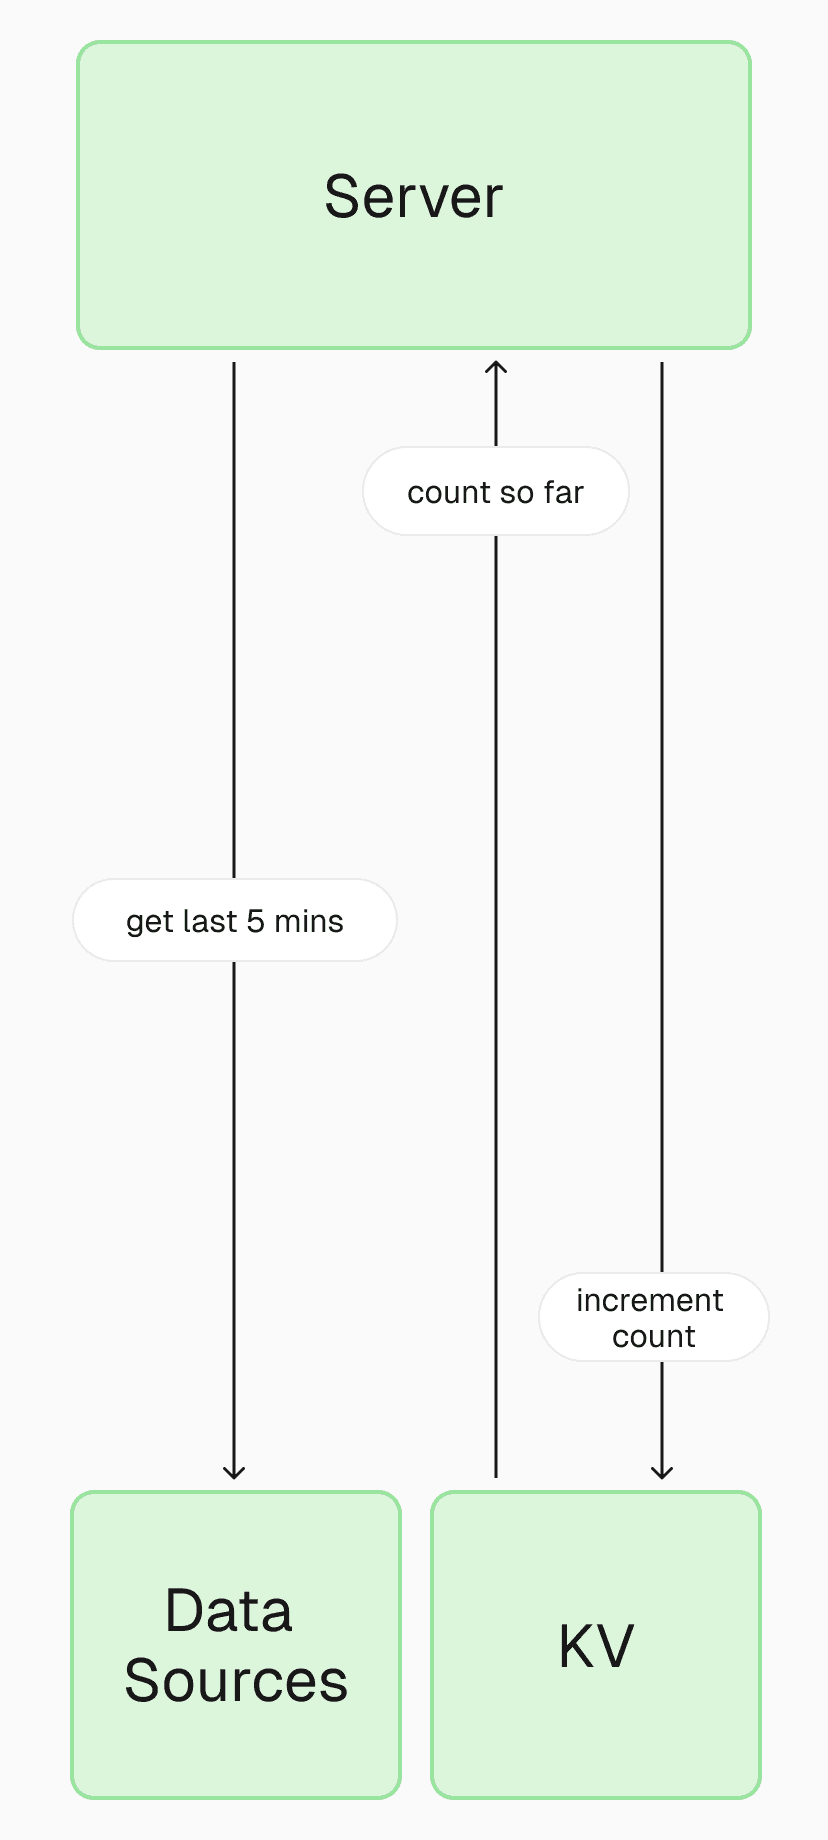
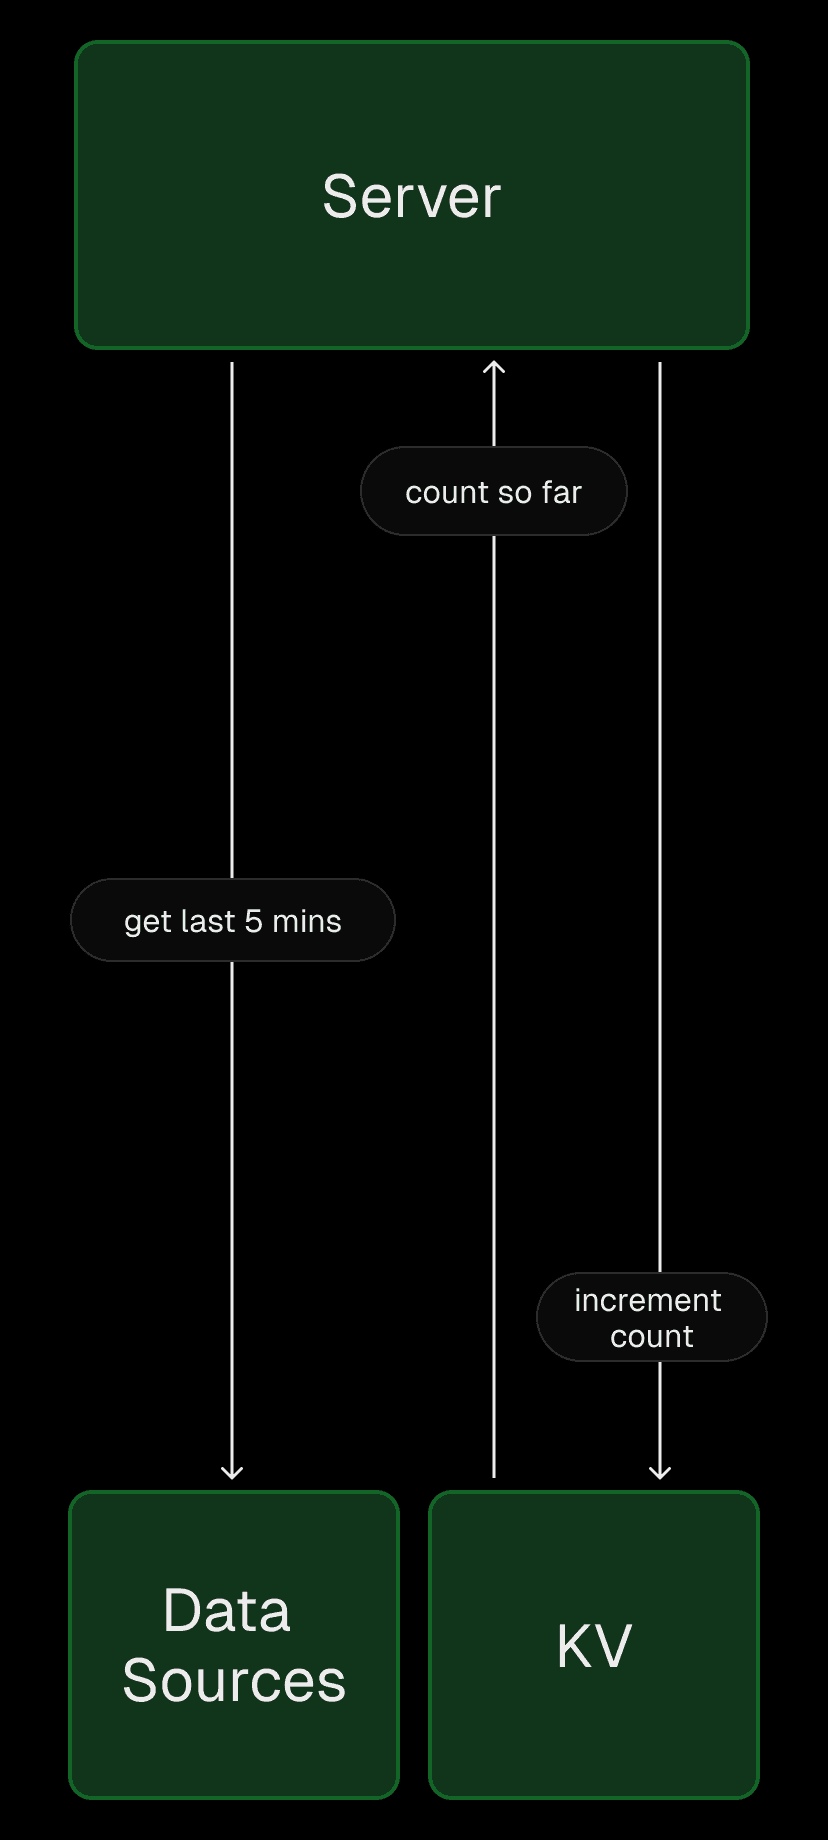
To minimize the amount of data to scan, we used a rolling window. Rather than querying from the beginning of Black Friday every time, we queried a smaller five-minute time period instead:
SELECT count() FROM requests WHERE timestamp > now() - INTERVAL 5 MINUTEUpdated SQL query with rolling window
This way, the query only needed to count the records from the last five minutes, resulting in cheaper and faster results. However, it also meant that we didn’t have the total count—the actual data we wanted to display.
To fix this, we used the Upstash KV integration on the Vercel Marketplace. We stored the cumulative count and had the server combine the two numbers into the total.


Link to headingSpeed: Using Incremental Static Regeneration (ISR)
All visitors to the BFCM dashboard saw the exact same data. Instead of calling the database for each visitor to the site, we could fetch data once and cache the response.


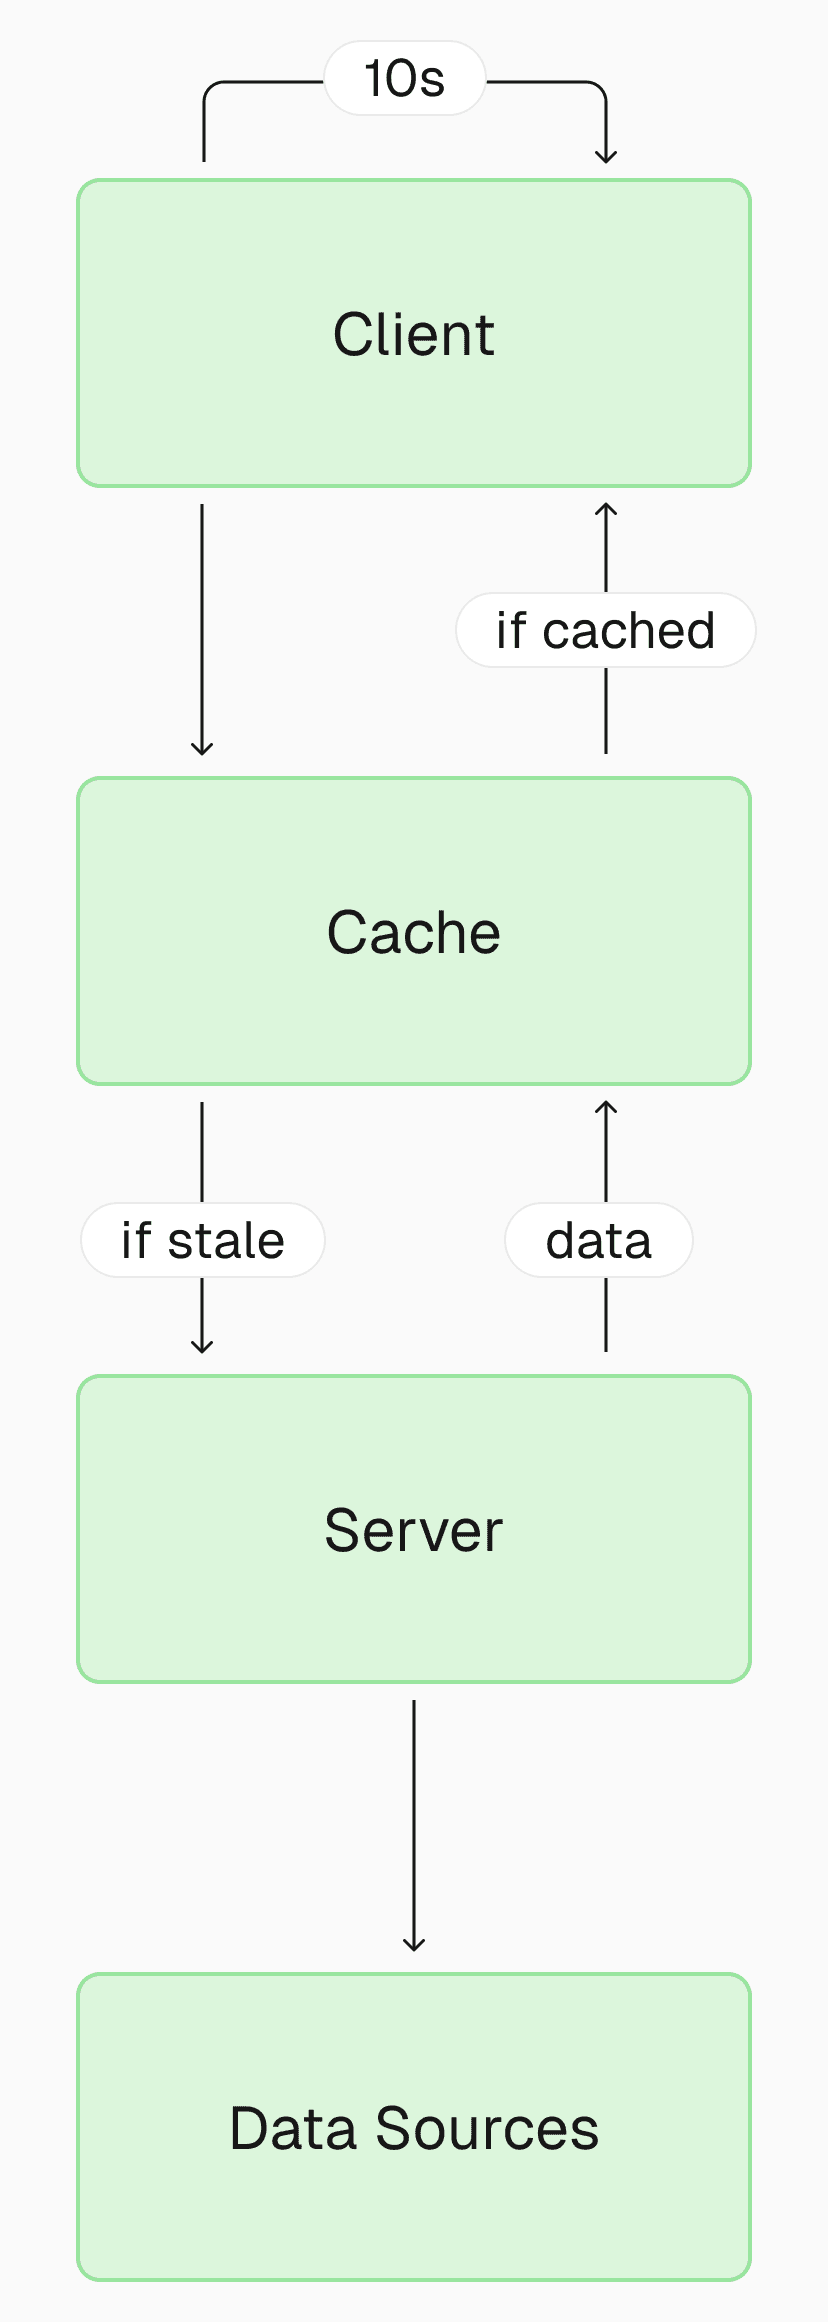
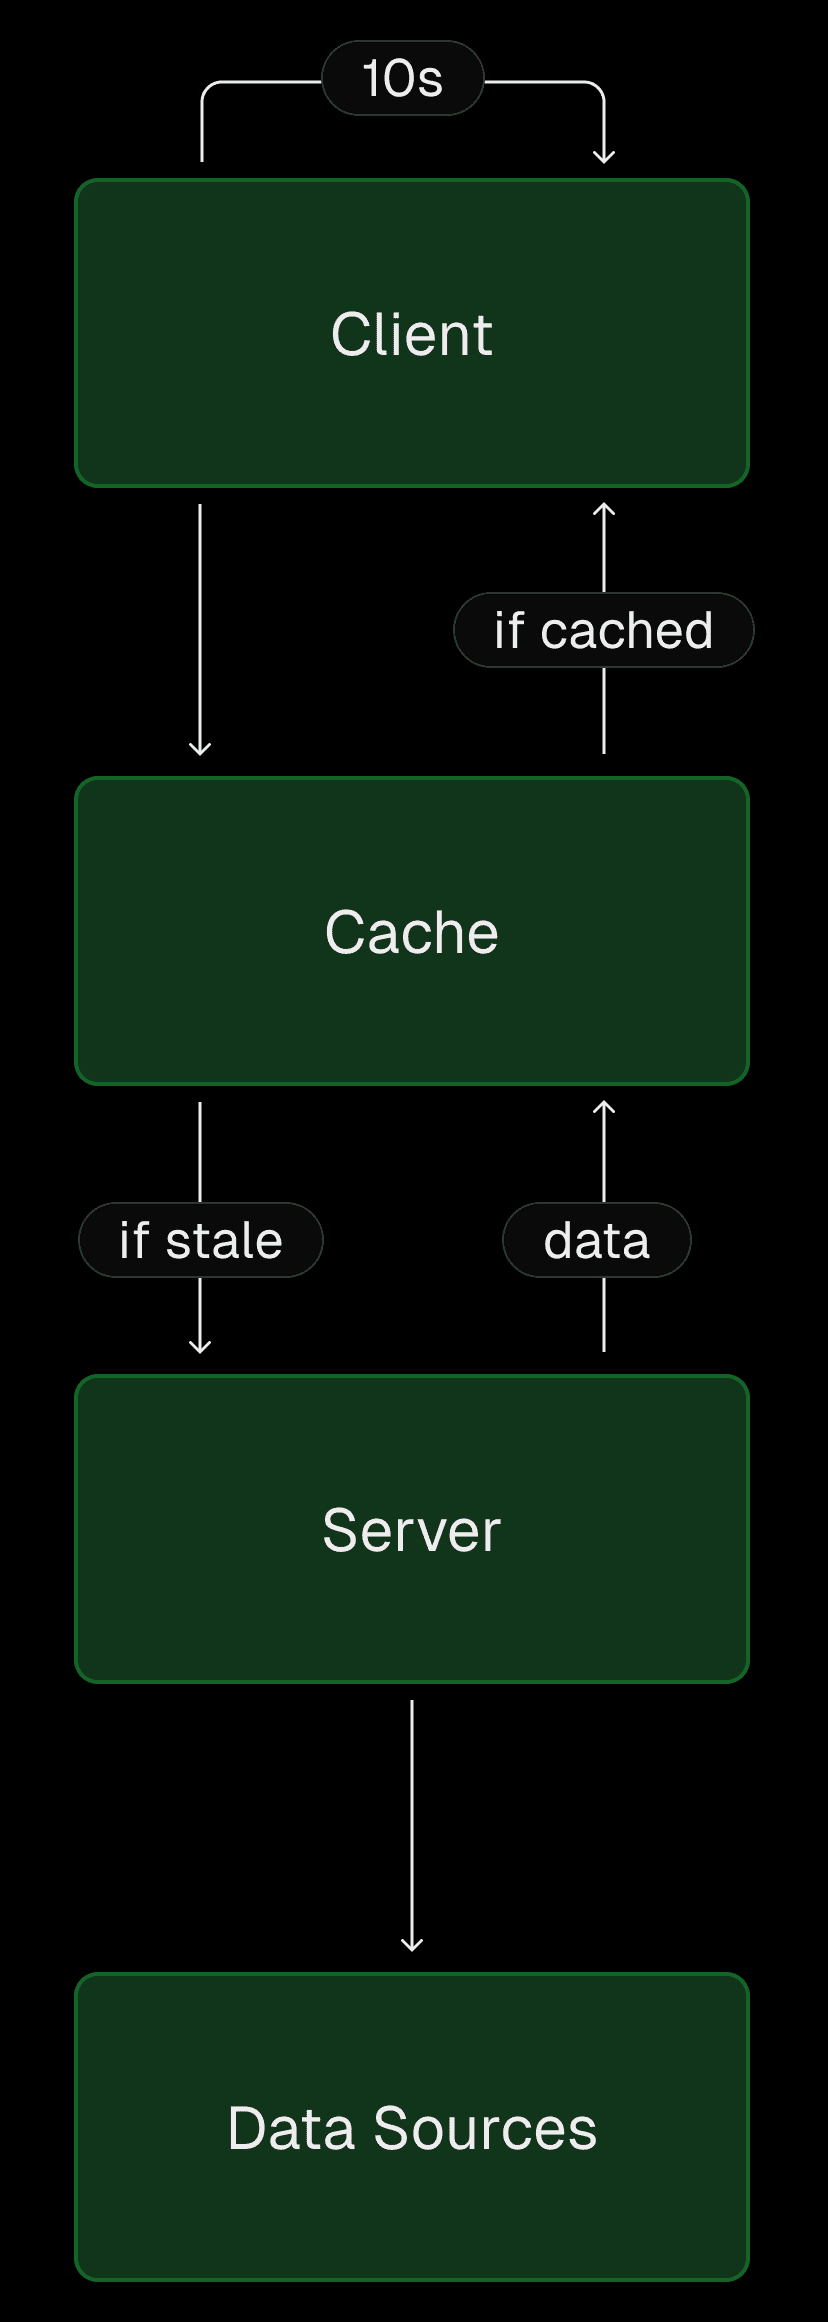
To keep data fresh, we invalidated the cache every five seconds. This also meant we only hit our database once in this time period.
To implement this, we used Next.js's built-in time-based Incremental Static Regeneration (ISR) by adding the following two lines of code to our page.tsx file:
// Tell Next.js to render the page as a static page, despite having fetch callsexport const dynamic = 'force-static';
// Invalidate the cache after 5 secondsexport const revalidate = 5; export default function Page() { ... }Rendering the page as a static page and setting time based revalidation
If the page was fresh (newer than five seconds): We returned the cached page
If the page was stale (older than five seconds): We returned the cached page and regenerated a fresh version of the page in the background. The next time a visitor viewed the site, we returned the fresh page


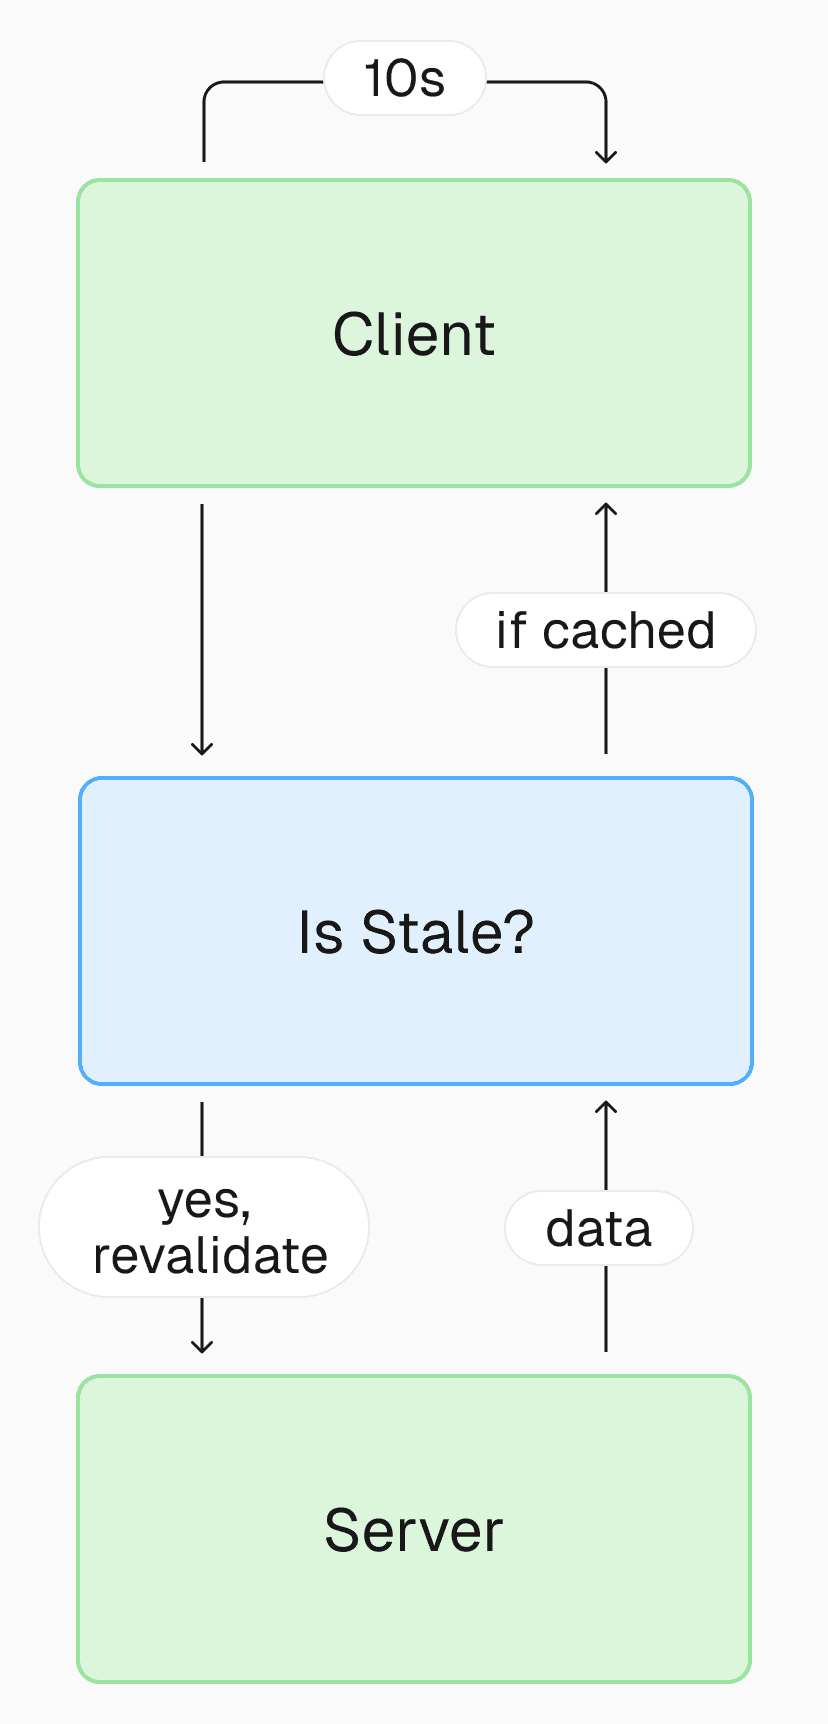
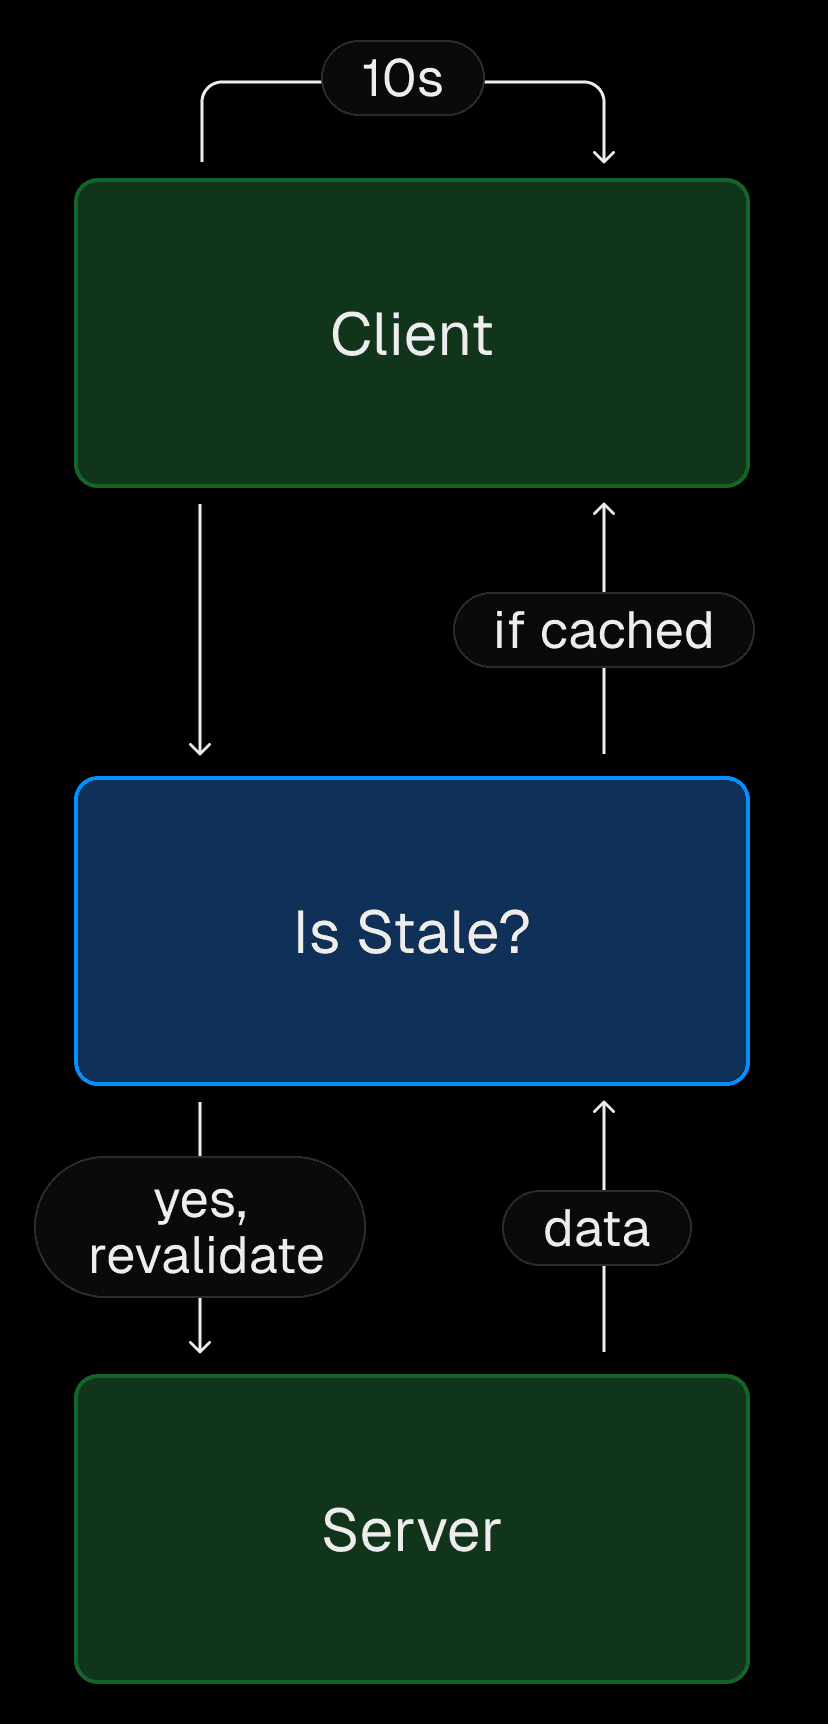
With those optimizations, our backend architecture was complete.
Link to headingFrontend optimizations
Our biggest frontend challenge was delivering a smooth real-time experience. Since the page polls every 10 seconds for new data, the numbers are only updated once in that time frame. This created a clunky jump in numbers when new data came in.


Link to headingUser experience: Dynamic visuals with rate of change
We wanted users to have dynamic visuals—simulating the feeling of the number constantly going up. We can achieve this by calculating the rate at which the metrics change over time.
In the backend, we calculated the rate without any infrastructure changes, since we already stored the previous count in a KV store:
export function getRateOfChange() { const lastCount = getCountFromKv(); const newCount = fetchLatestCount(); // only from last 5 minutes const rateOfChange = newCount / (Date.now() - lastCount.timestamp) return rateOfChange;}Then, we passed this rate and value to a client component and used requestAnimationFrame to increment the number in the frontend:
'use client';
import { useEffect, useRef } from 'react';
export function Counter({ value, rateOfChange }) { const ref = useRef(null);
useEffect(() => { let id; const increment = (ts) => { if (!ref.current) return;
ref.current.textContent = value + rateOfChange * ts; id = requestAnimationFrame(increment); }; id = requestAnimationFrame(increment); return () => { cancelAnimationFrame(id); }; }, [rateOfChange]);
return <span ref={ref}>{value}</span>;}Link to headingAccuracy: Preventing over/undercounting
While incrementing the count in the frontend provides a smooth visual effect, it can lead to discrepancies between the displayed count and the actual count from the backend.
For accuracy, we dynamically adjusted the rate of change by calculating the difference between the value displayed and the new updated value. This way, if we overcounted, we slowed down the update rate. If we undercounted, we sped it up. To do this we:
Tracked the previous rate and value
Calculated the difference between the old value and the new value
Adjusted the rate of change based on the difference to fine-tune animation speed
Updated the previous ref for the next calculation
Updated the current ref with the new value
'use client';
import { useEffect, useRef, useState } from 'react';
export function Counter({ value, rateOfChange }) { const [rate, setRate] = useState(rateOfChange);
const lastMetric = useRef({ value, timestamp: null, });
useEffect(() => { const percentageDiff = lastMetric.current.value / value; setRate(rateOfChange * percentageDiff); }, [value, rateOfChange]);
const ref = useRef(null);
useEffect(() => { let id; const increment = (ts) => { if (!ref.current) return;
const { timestamp, value } = lastMetric.current; lastMetric.current.timestamp = ts;
const lastTime = timestamp ?? ts; const diff = (ts - lastTime) * rate; const newValue = value + diff;
lastMetric.current.value = newValue; ref.current.textContent = newValue; id = requestAnimationFrame(increment); }; id = requestAnimationFrame(increment); return () => { cancelAnimationFrame(id); }; }, [rate]);
return <span ref={ref}>{value}</span>;}Link to headingPerformance: Using React Server Components
The BFCM dashboard is built mostly using React Server Components (RSCs). The only client components needed were ones that did animation. By using RSCs, we were able to simplify our data-fetching logic.
In a typical client-side app, we would fetch data using a combination of useState and useEffect:
const [data, setData] = useState(null);useEffect(() => setData(getData()), []);Fetching data on the client results in:
Data being delayed until the user’s browser can download, parse, and execute JavaScript
The data fetching itself being dependent on the user’s internet connection
Performance aside, client-side fetching also means we would need to implement and expose API endpoints for the client to get data.
export async function GET() { return getData();}With RSCs, we were able to move data fetching to the server using async/await:
async function Statistics() { const { value, rateOfChange } = await getData(); return <Counter value={value} rateOfChange={rateOfChange} />;}By calling getData directly in the component, we eliminate the need for API endpoints. As a result, users received only what they need—the fully rendered components—with no additional calls on initial page load.


Link to headingSummary
Building data-heavy websites that are cost-efficient, performant, accurate, and have a good user experience is possible by addressing performance bottlenecks one step at a time:
Making queries more efficient by getting the incremental count instead of total count
Using ISR to minimize the number of database calls
Giving users dynamic visuals with rate-of-change tactics
Ensuring accuracy with dynamic rate adjustments
Moving data fetching to the server for better performance
Even the most demanding sites can use Vercel and Next.js to create great experiences. We hope this behind-the-scenes exploration of the BFCM dashboard's architecture provides valuable insights for your own site.
Prepare for BFCM 2025
If you’re looking ahead to next year’s BFCM, watch the recording of our Black Friday 2025 virtual event hosted by Vercel CTO Malte Ubl.
Watch now