1 min read


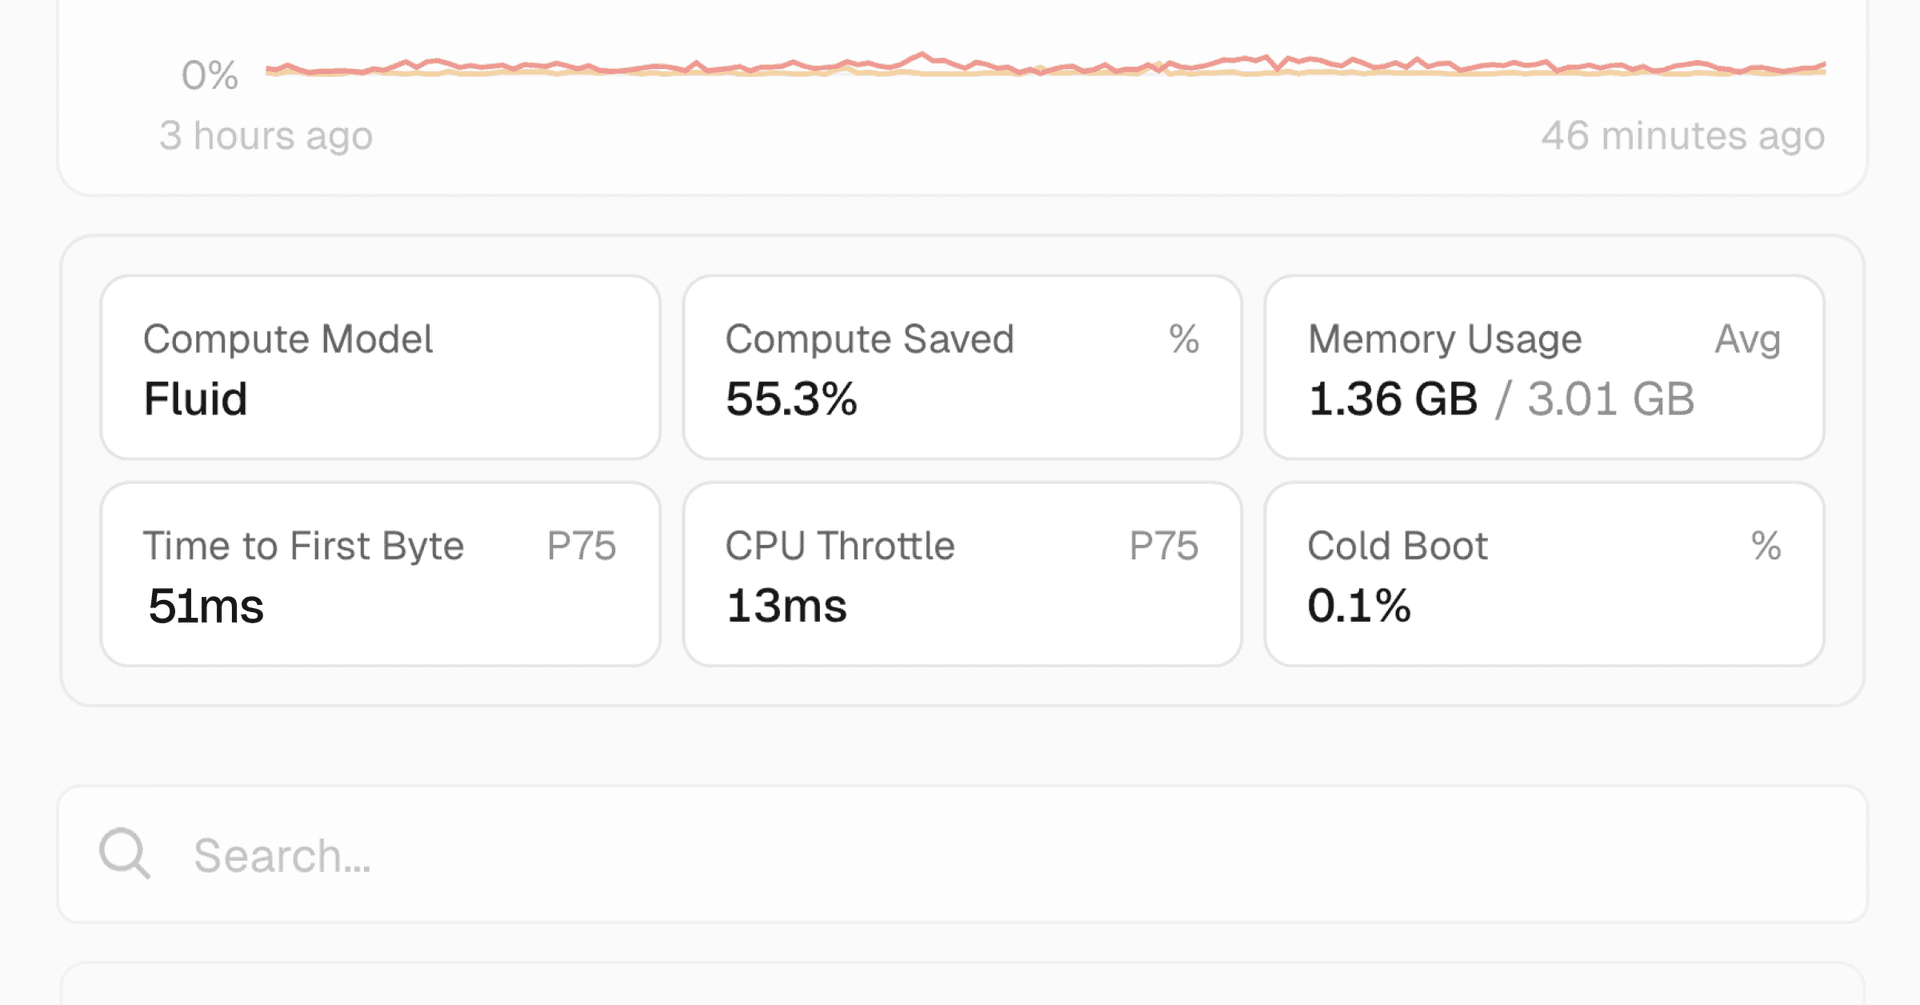
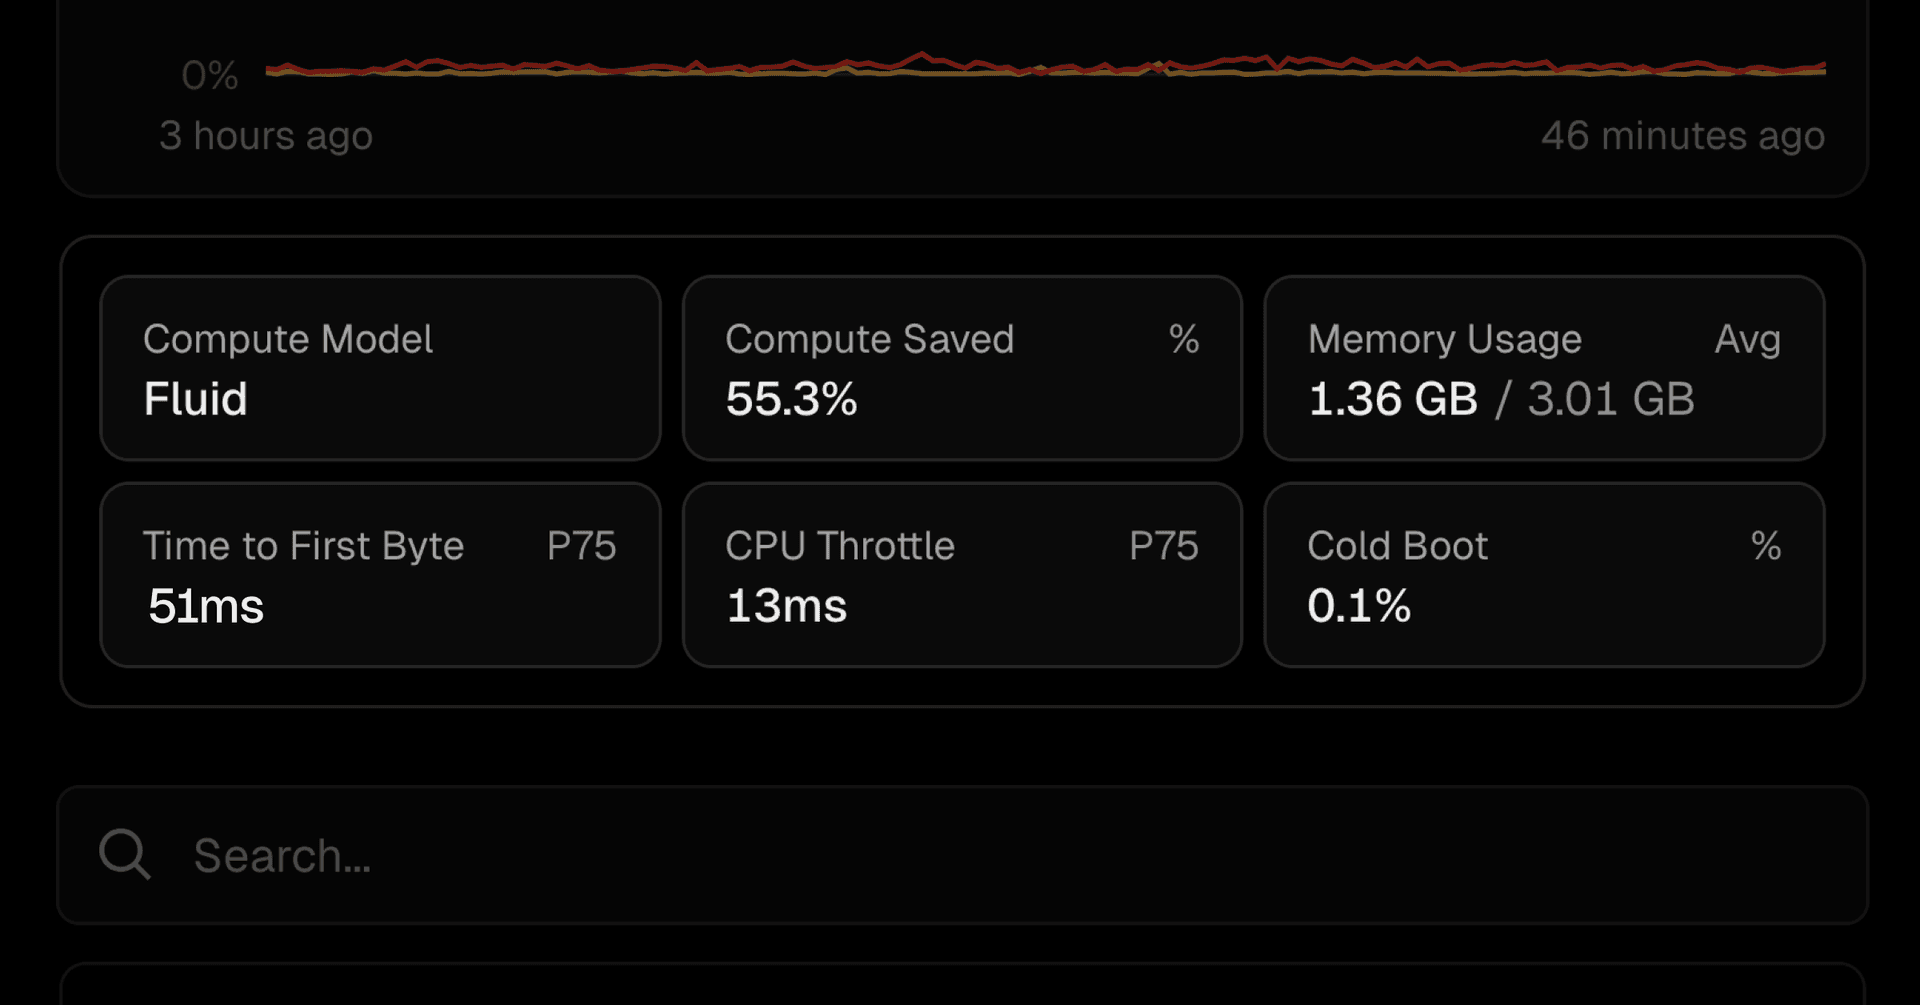
Observability's Vercel Functions dashboard now shows quick-view tiles with key metrics, such as:
Active compute model, like Fluid compute, which enhances efficiency, minimizes cold starts, and optimizes performance
Compute saved with Fluid compute enabled
Average memory usage for your functions
P75 Time to First Byte (TTFB) for performance monitoring
Cold start frequency to track optimization impact
These insights are available for all plans.
Learn more about Observability and Fluid compute.