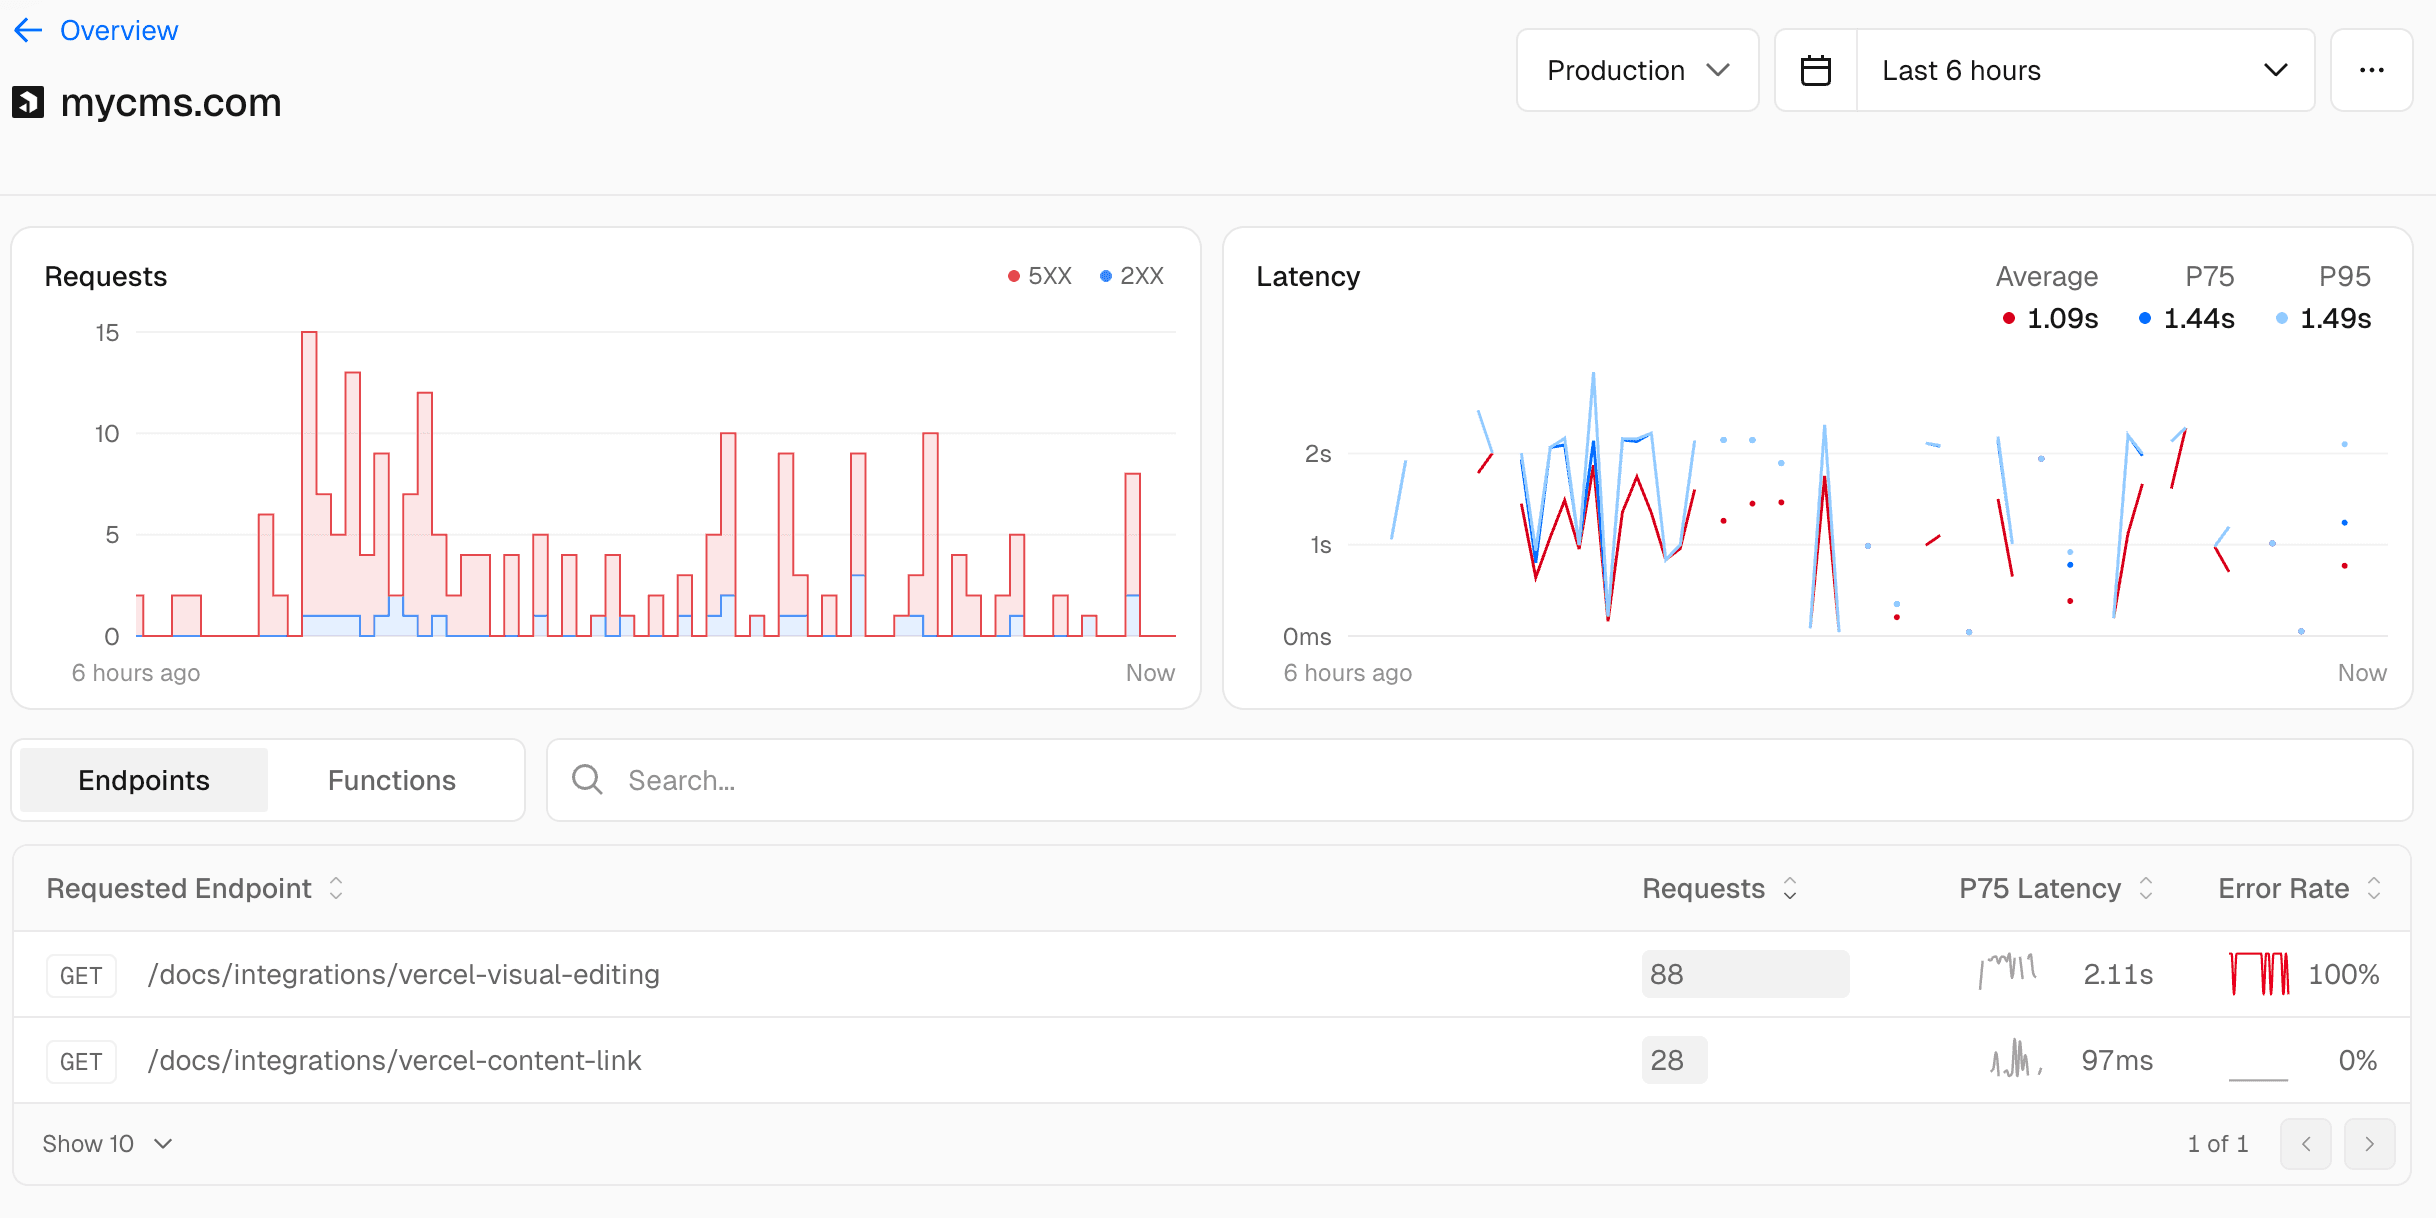
Problem: One of your functions is timing out, not serving responses quickly enough, or otherwise alerting.
You can use Observability to investigate and understand slow responses from your functions and its effects on function duration, error rates, and consumption. To do so:
- From your dashboard, select the project you want to investigate.
- Navigate from your dashboard to the Observability tab.
- Choose External APIs and set an appropriate time range filter (e.g. last 6 hours).
- From the list, sort by P75 duration to find hosts with the slowest response times, e.g.
mycms.com: {' '}
Media - Select the hostname with high duration or error rate:
{' '}

Media - You can see a distribution of requests over time, as well as their latency. When selecting Functions, you can see which of your function routes sent the requests to the slow external API and navigate to the appropriate view right away.

