1 min read


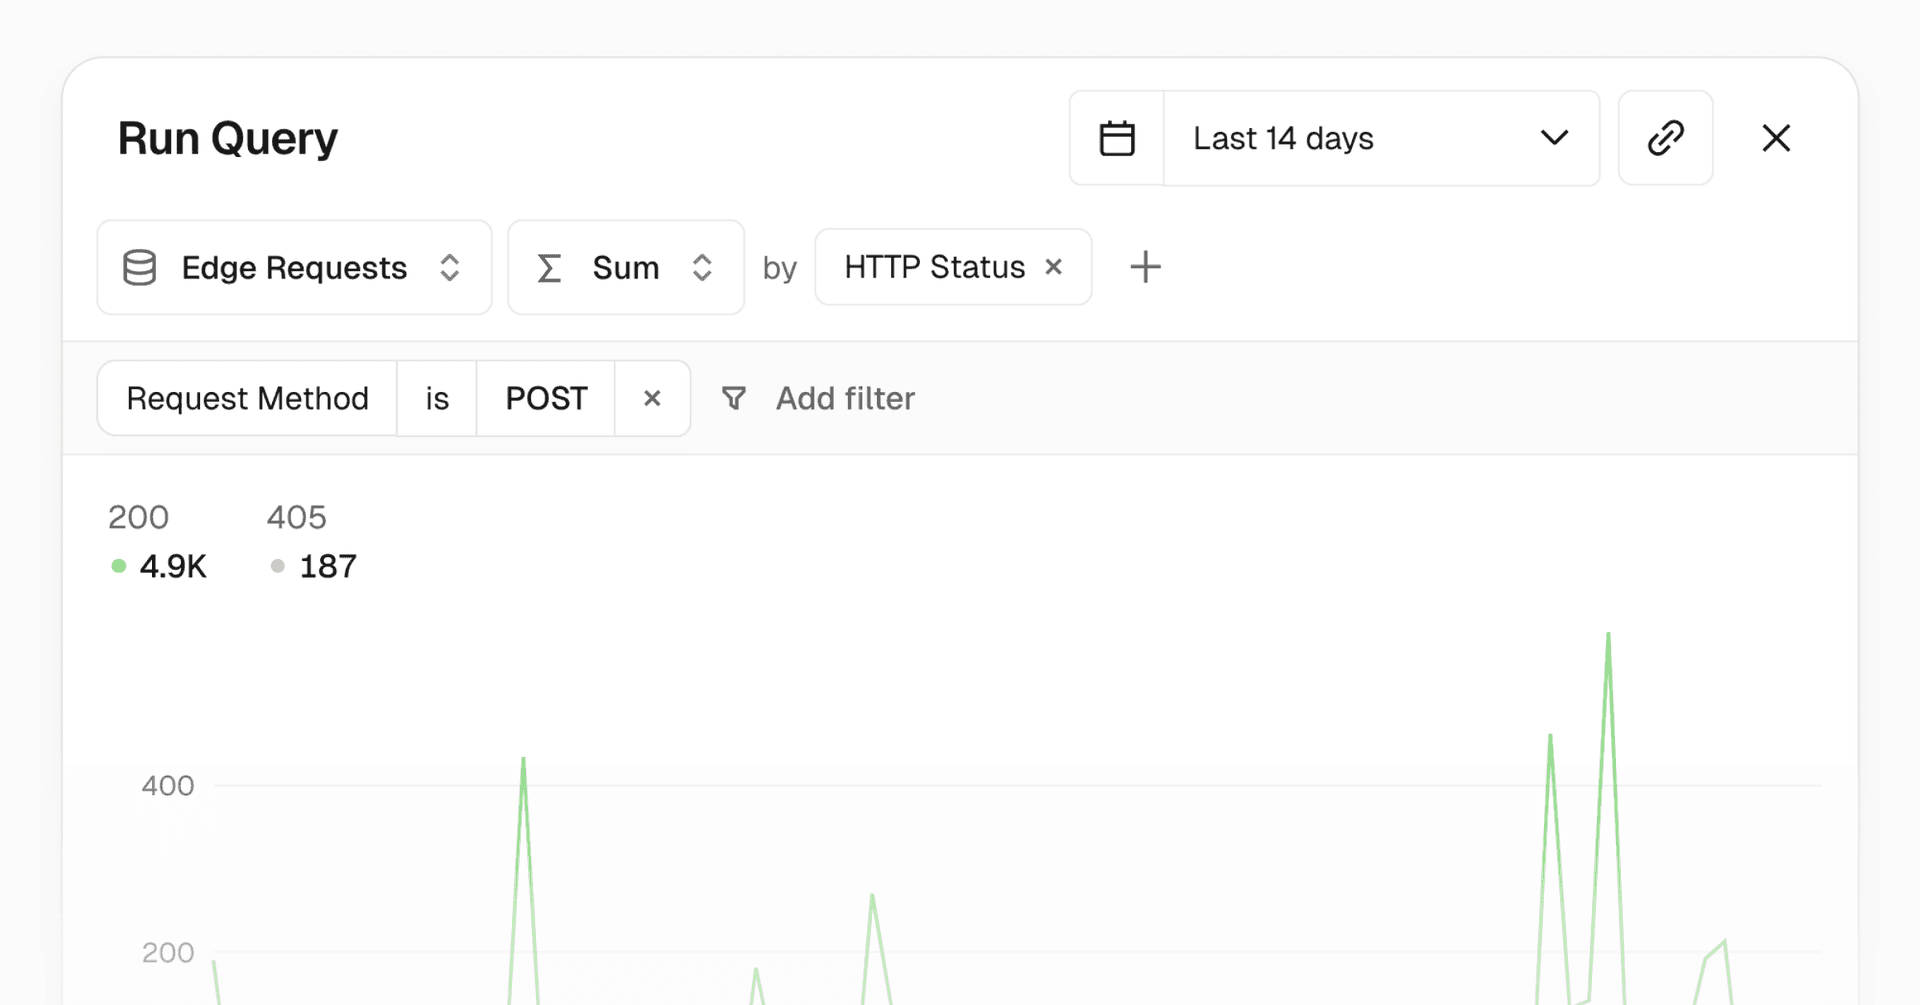
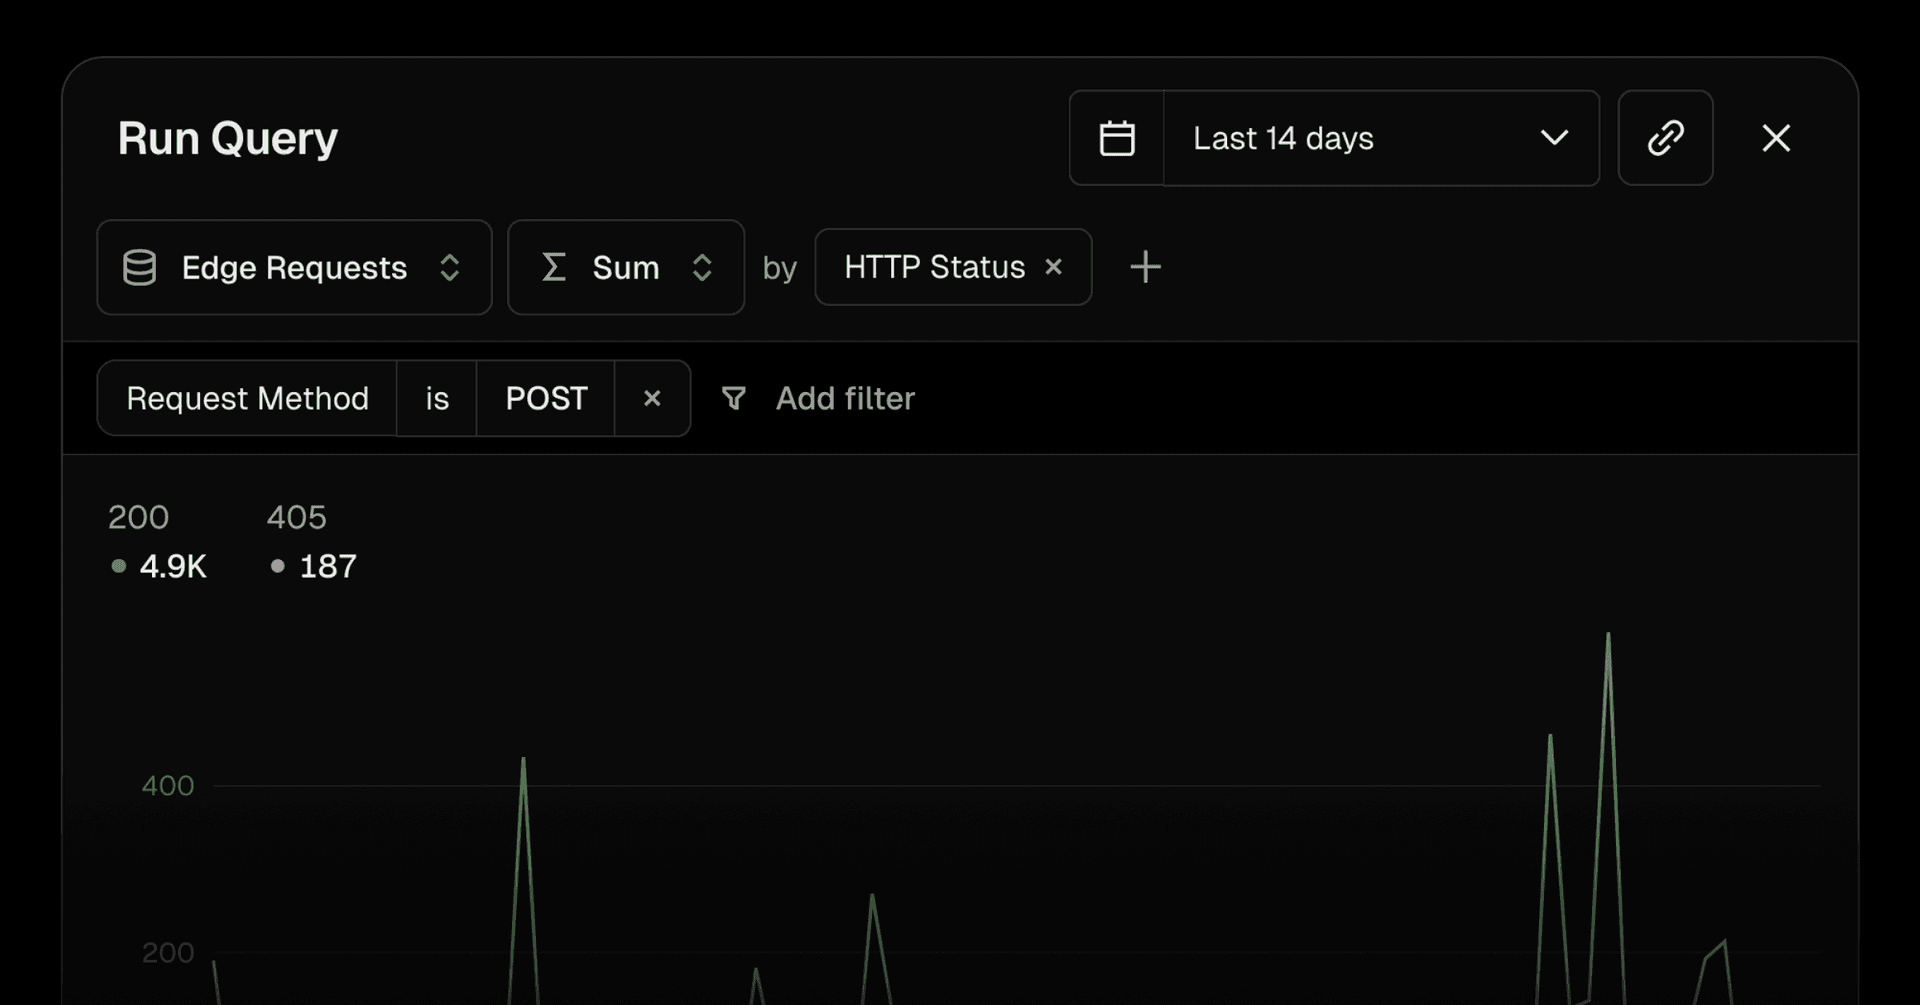
Observability Plus customers can now create and share custom queries directly from the Observability dashboard—making it easier to investigate specific metrics, routes, and application behavior without writing code.
The new query interface lets you:
Filter by route to focus on specific pages and metrics
Use advanced filtering, with auto-complete—no query language needed
Analyze charts in the context of routes and projects
Share queries instantly via URL or Copy button
This new querying experience builds on the Monitoring dashboard, helping you stay in context as you drill deeper into your data.
To try it out, open your Observability dashboard and select Explore query arrows on any chart or the query builder from the ellipsis menu.
Learn more about running queries in Observability and its available metrics.