3 min read
Vercel Log Drains are now Vercel Drains.
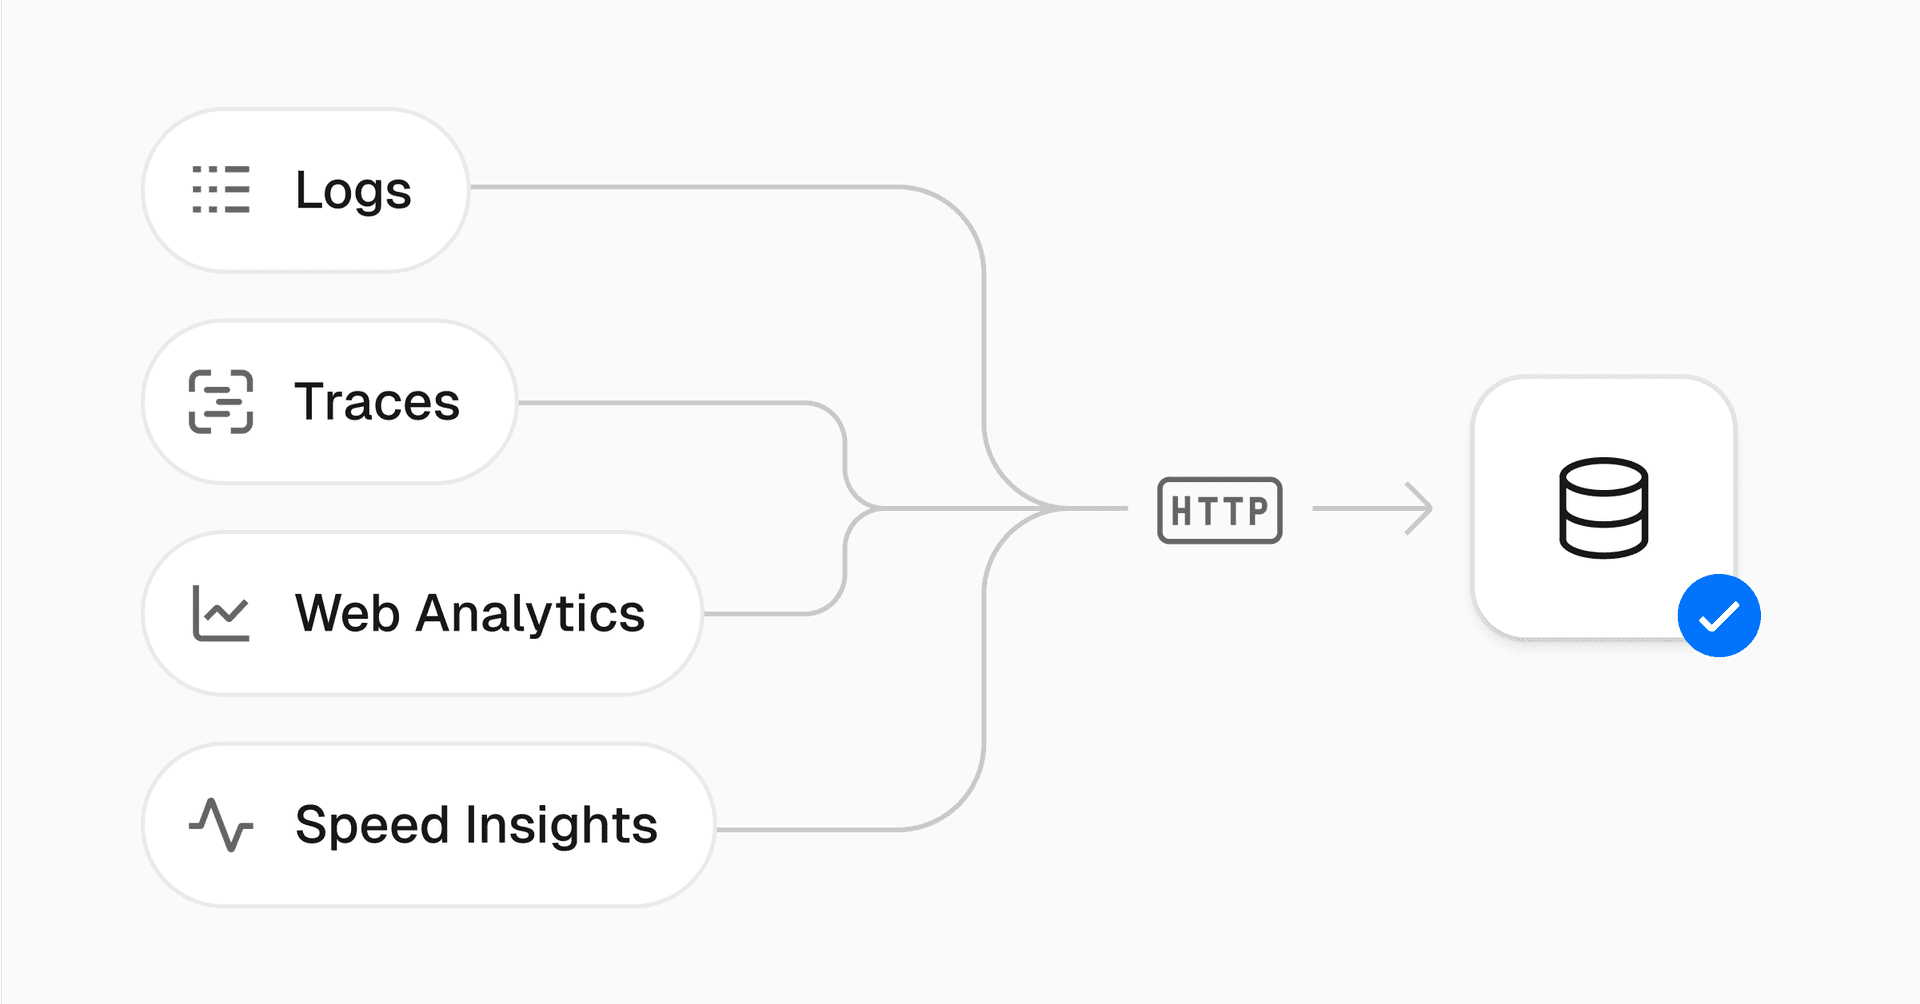
Why? They’re not just for logs anymore, as you can now also export OpenTelemetry traces, Web Analytics events, and Speed Insights metrics.
Drains give you a single way to stream observability data out of Vercel and into the systems your team already rely on.
Link to headingWhy drains matter
Most teams already have an observability stack they trust like Datadog, Honeycomb, Grafana, Elastic, or their own warehouses. But those systems are only as good as the data they receive. Logs alone don’t explain how modern apps behave.
To fully understand performance, you need more than log lines. Traces show how a request moves through serverless functions. Analytics capture user interactions. Real-user metrics reveal what’s happening in the browser.
Vercel Drains unify these signals into a single pipeline, streaming complete data to the tools you already use, and
Logs: Runtime, build, static asset, firewall, and function logs.
Traces: Trace Drains forward distributed tracing data from your deployments.
Web Analytics: Lightweight page view and custom event data.
Speed Insights: Real-user performance metrics and Web Vitals.
Because Vercel runs the entire request path, from the browser through to dynamic function execution, these signals are consistent and correlated. Logs from traced requests are automatically enriched with traceId and spanId, so you can move from a log line straight into the distributed trace it belongs to.


Link to headingTwo ways to drain data
Drains can be created in two forms, depending on how you want to connect:
1. Custom drains: Set up a drain to any HTTP endpoint you control. You can:
Pick the data type (logs, traces, analytics, or performance metrics)
Configure sampling rates to manage traffic
Choose JSON, NDJSON, or Protobuf
Add headers or signature verification for security
For example, you might stream traces to an OTLP collector, logs into a self-hosted Elastic cluster, and analytics events into Snowflake.
2. Integration drains: Vercel has turnkey integrations with vendors like Dash0, Statsig, Datadog, Logflare, and more. These direct integrations help handle the configuration automatically and begin streaming logs into your account.
Link to headingEnd-to-end observability
The advantage of Drains on Vercel is the context. A spike in LCP can be tied back to the trace of a slow API call. A 500 error log can be tied to the specific request that triggered it. By exporting logs, traces, analytics, and performance metrics together, you get one continuous view of how your app behaves in production, to any tools you already use.
Since traces follow the OpenTelemetry protocol, they plug directly into Datadog APM, Honeycomb, Grafana Tempo, New Relic, or any vendor that supports OTel, with no custom instrumentation needed. Logs and traces correlate automatically, and analytics can be streamed into the same warehouse you use for business reporting.
Drains are available now on Pro and Enterprise plans. Data exported via Drains is billed at $0.50 per GB, the same rate as existing log drains. You can configure multiple drains per team, across as many projects as needed.
Link to headingGet started
You can set up Drains today from your Vercel dashboard → Team Settings → Drains. Choose a Custom HTTP endpoint to stream any data type, or install an Integration from the Marketplace for a managed setup.
Read the full docs for configuration details, supported formats, and schema references.