


Vercel Sandbox observability now includes memory usage data.
You can access sandbox memory usage data in the dashboard and through the CLI via the vercel metrics command.
Copy link to headingSandbox observability memory in the dashboard
The Memory Usage card reports average, P75, and P95 memory across your sandboxes, alongside the existing CPU usage and data transfer metrics on the sandbox overview page and the project and team-level pages.
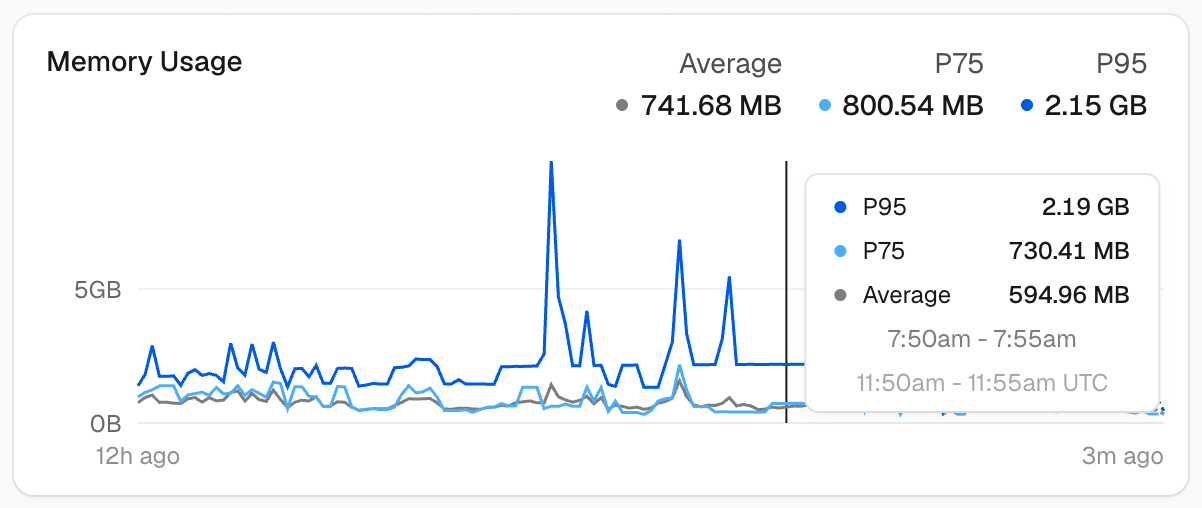
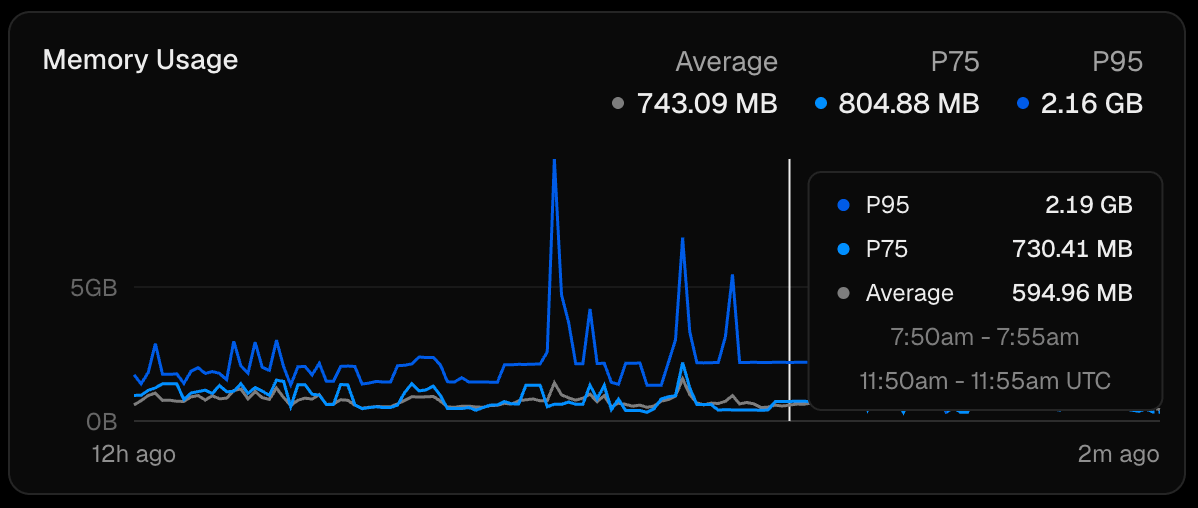
On the sandbox detail page, charts are designed to show how close a sandbox is running to its memory ceiling by:
Automatically scaling the y-axis to sandbox's memory limit
Adding a dashed reference line at 85% of that limit
Sandbox memory is also available in the Observability query builder as the memoryUsedBytes measure on the sandbox usage event. You can build custom queries against it and create alerts from the chart.
Copy link to headingSandbox memory observability in the CLI
Sandbox observability data is also available through the Vercel CLI via the vercel metrics command under vercel.sandbox.memory_used_bytes. Run the command in a linked project for project-specific data, or append --all to see aggregate data across all projects in your team.
The CLI returns:
The metric
The reporting period
The measurement interval
The project the sandbox is associated with
A graph of memory usage, with min, max and avg values
Learn more in the Sandbox documentation.