

AI Gateway Production Index — October 2026
Every month, AI Gateway routes tens of trillions of tokens between production applications and AI labs. That traffic gives us a view of what AI usage actually looks like in today's enterprise, and we publish it here monthly. See the Production Index reports from July, August, and September.
Copy link to headingOctober 2026 summary
Open-weight models now process more than seven in ten gateway tokens and account for nearly one in four dollars. Their share of spend has more than quadrupled since June.
September’s gateway spend was about 13 times December’s, while the average price per token was 47% lower. Almost one in three teams changed their most-used lab in September, an index record.
Nearly 70% of September’s gateway spend on Chinese models went through US-based providers, up from less than 10% in December.
Jev was the fastest-adopted model in AI Gateway history, reaching 35% of paid teams in its first two weeks, but it accounted for just 0.27% of gateway spend over that same period. Opus 5.5 took more than one in ten gateway dollars in its own first two weeks, the largest spend share of any September model launch.
Copy link to headingFrontier spend up 900%, spend share down 22%
In August, open-weight models processed the majority of AI Gateway token volume for the first time. The money is now following. Open weight’s share of spend has more than quadrupled over the last three months, from one in twenty gateway dollars in June to nearly one in four in September.
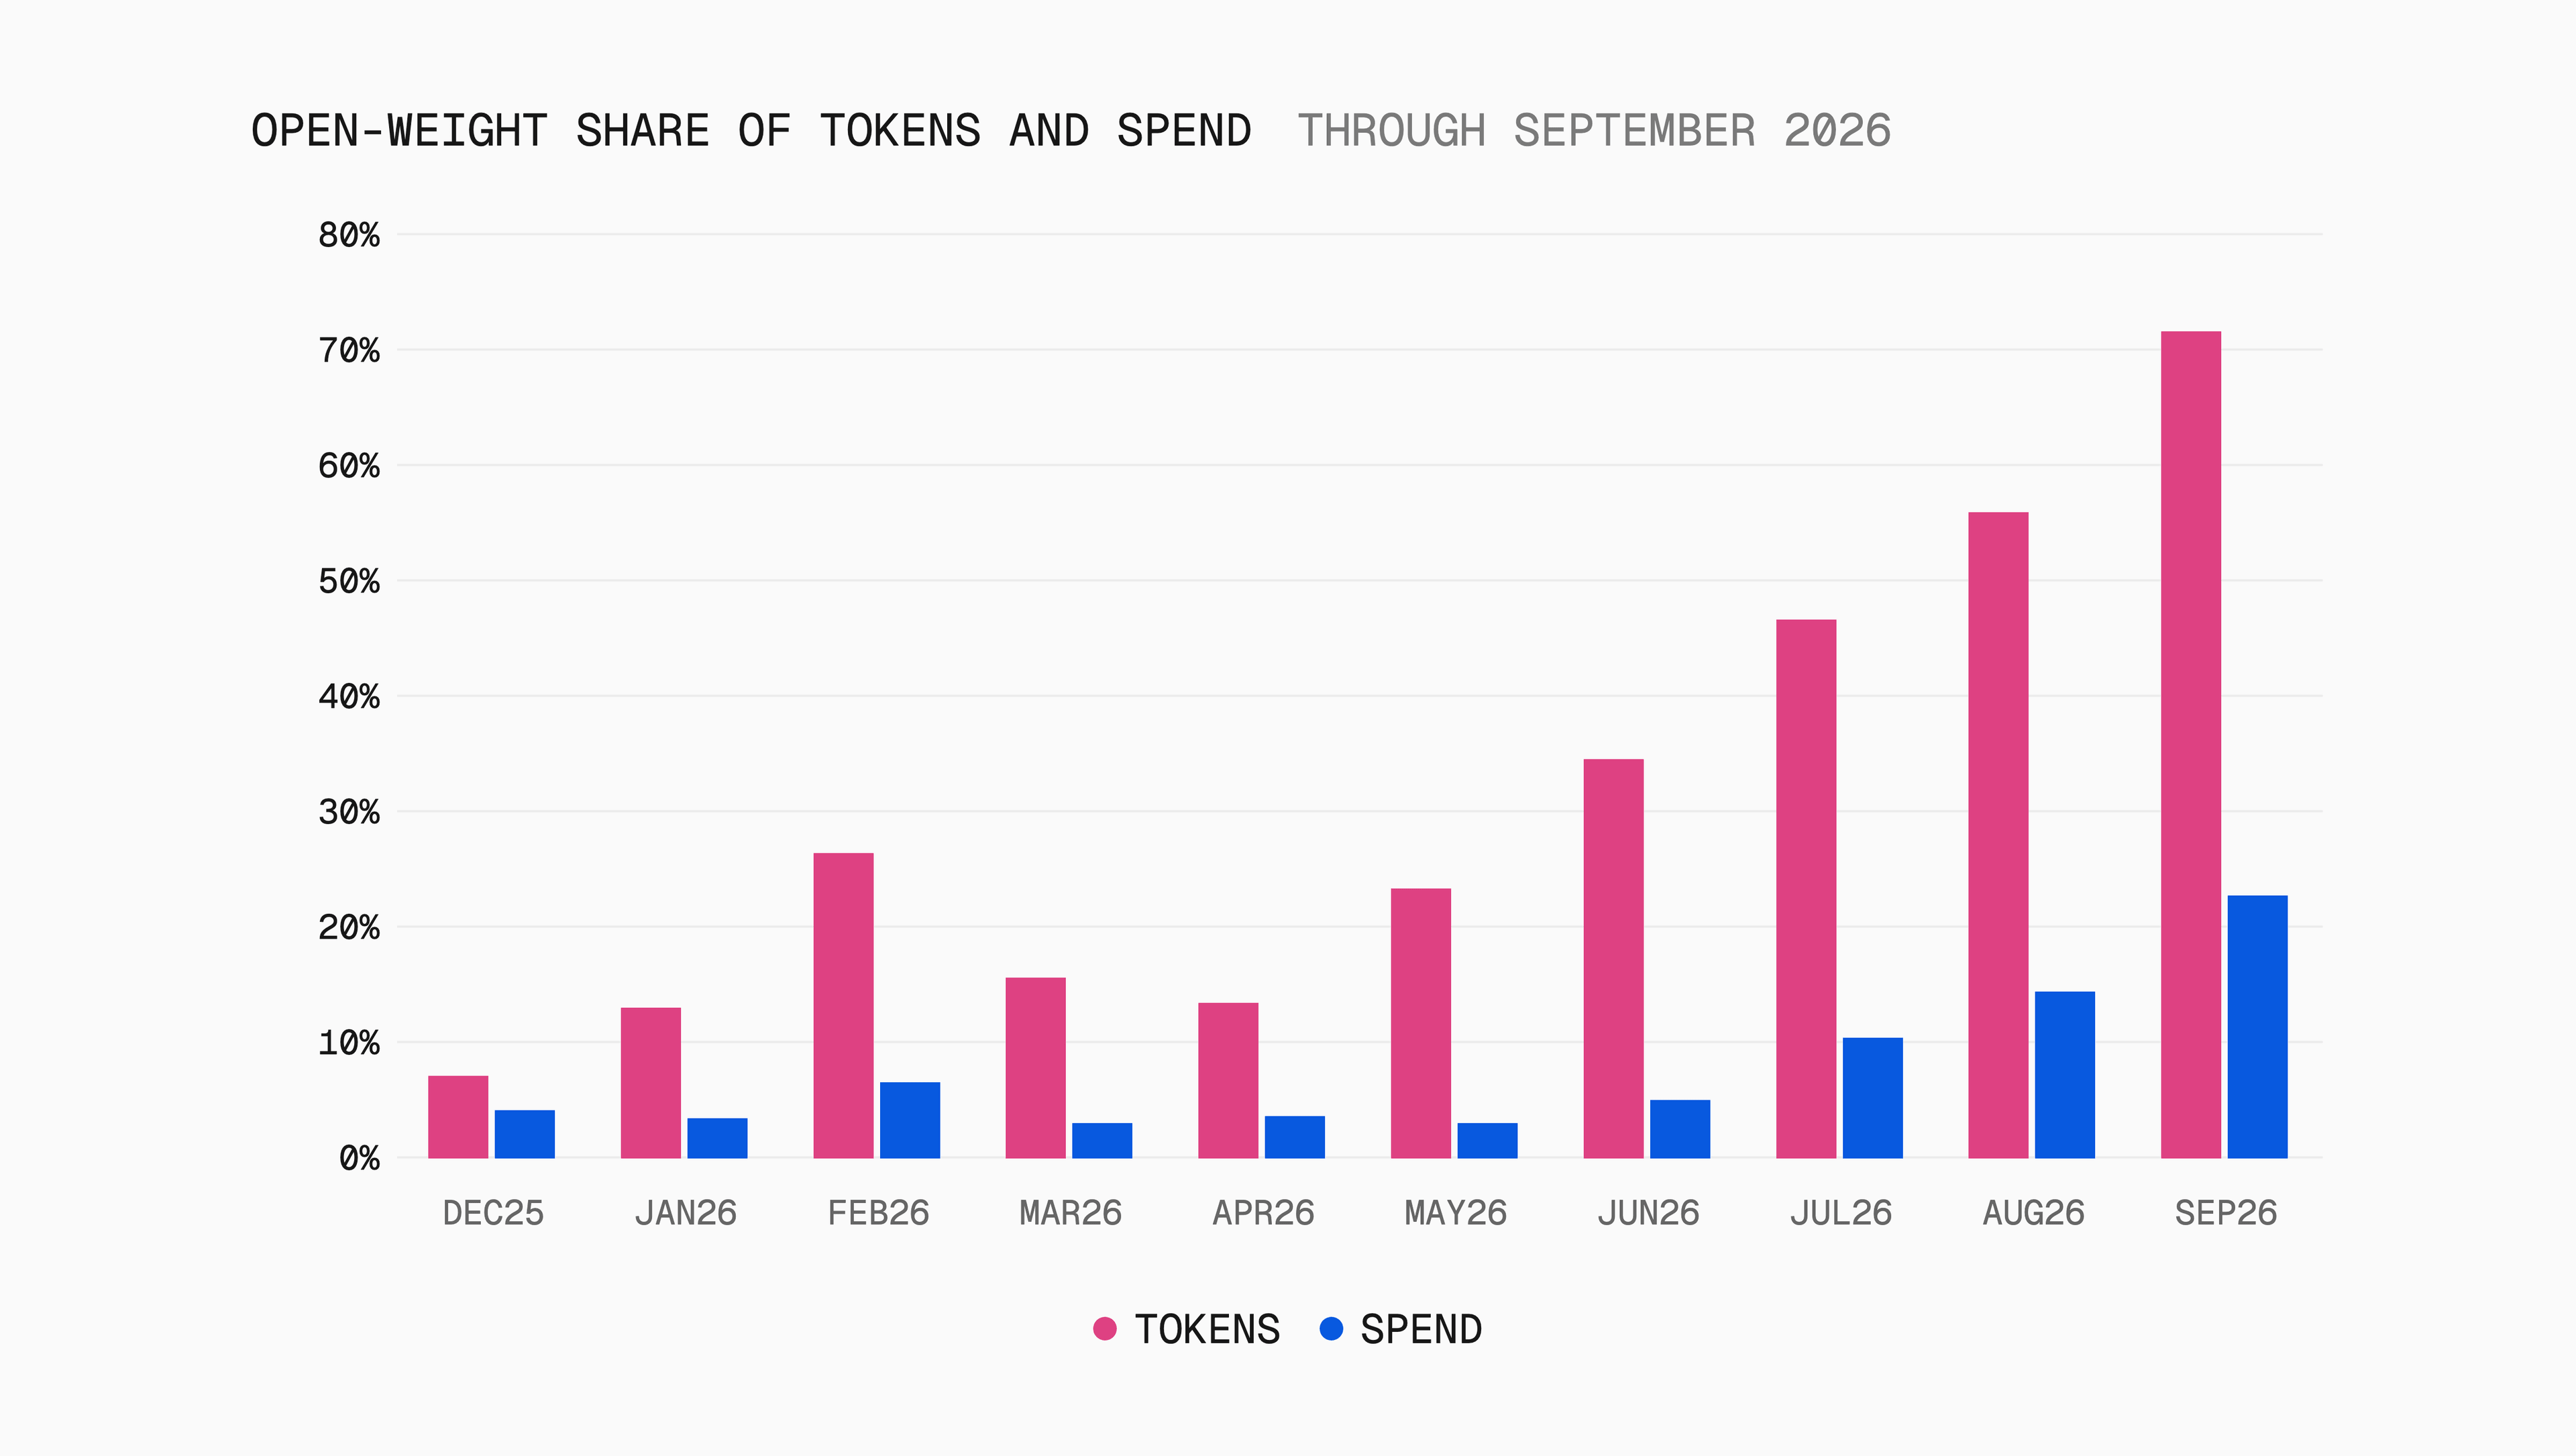
Open weight's growth is coming from both ends of its price range, and it mirrors the wider gateway. The cheapest models drive token growth, while the expensive models drive spend.
Led by Kimi K3, models priced at least four times the open-weight average cost per token accounted for about two-thirds of the increase in open-weight spend.
In contrast, DeepSeek-v4.1-Flash alone processed nearly half of all September tokens but took just 2.6% of spend. Its price per token was about a fifth of the open-weight average.
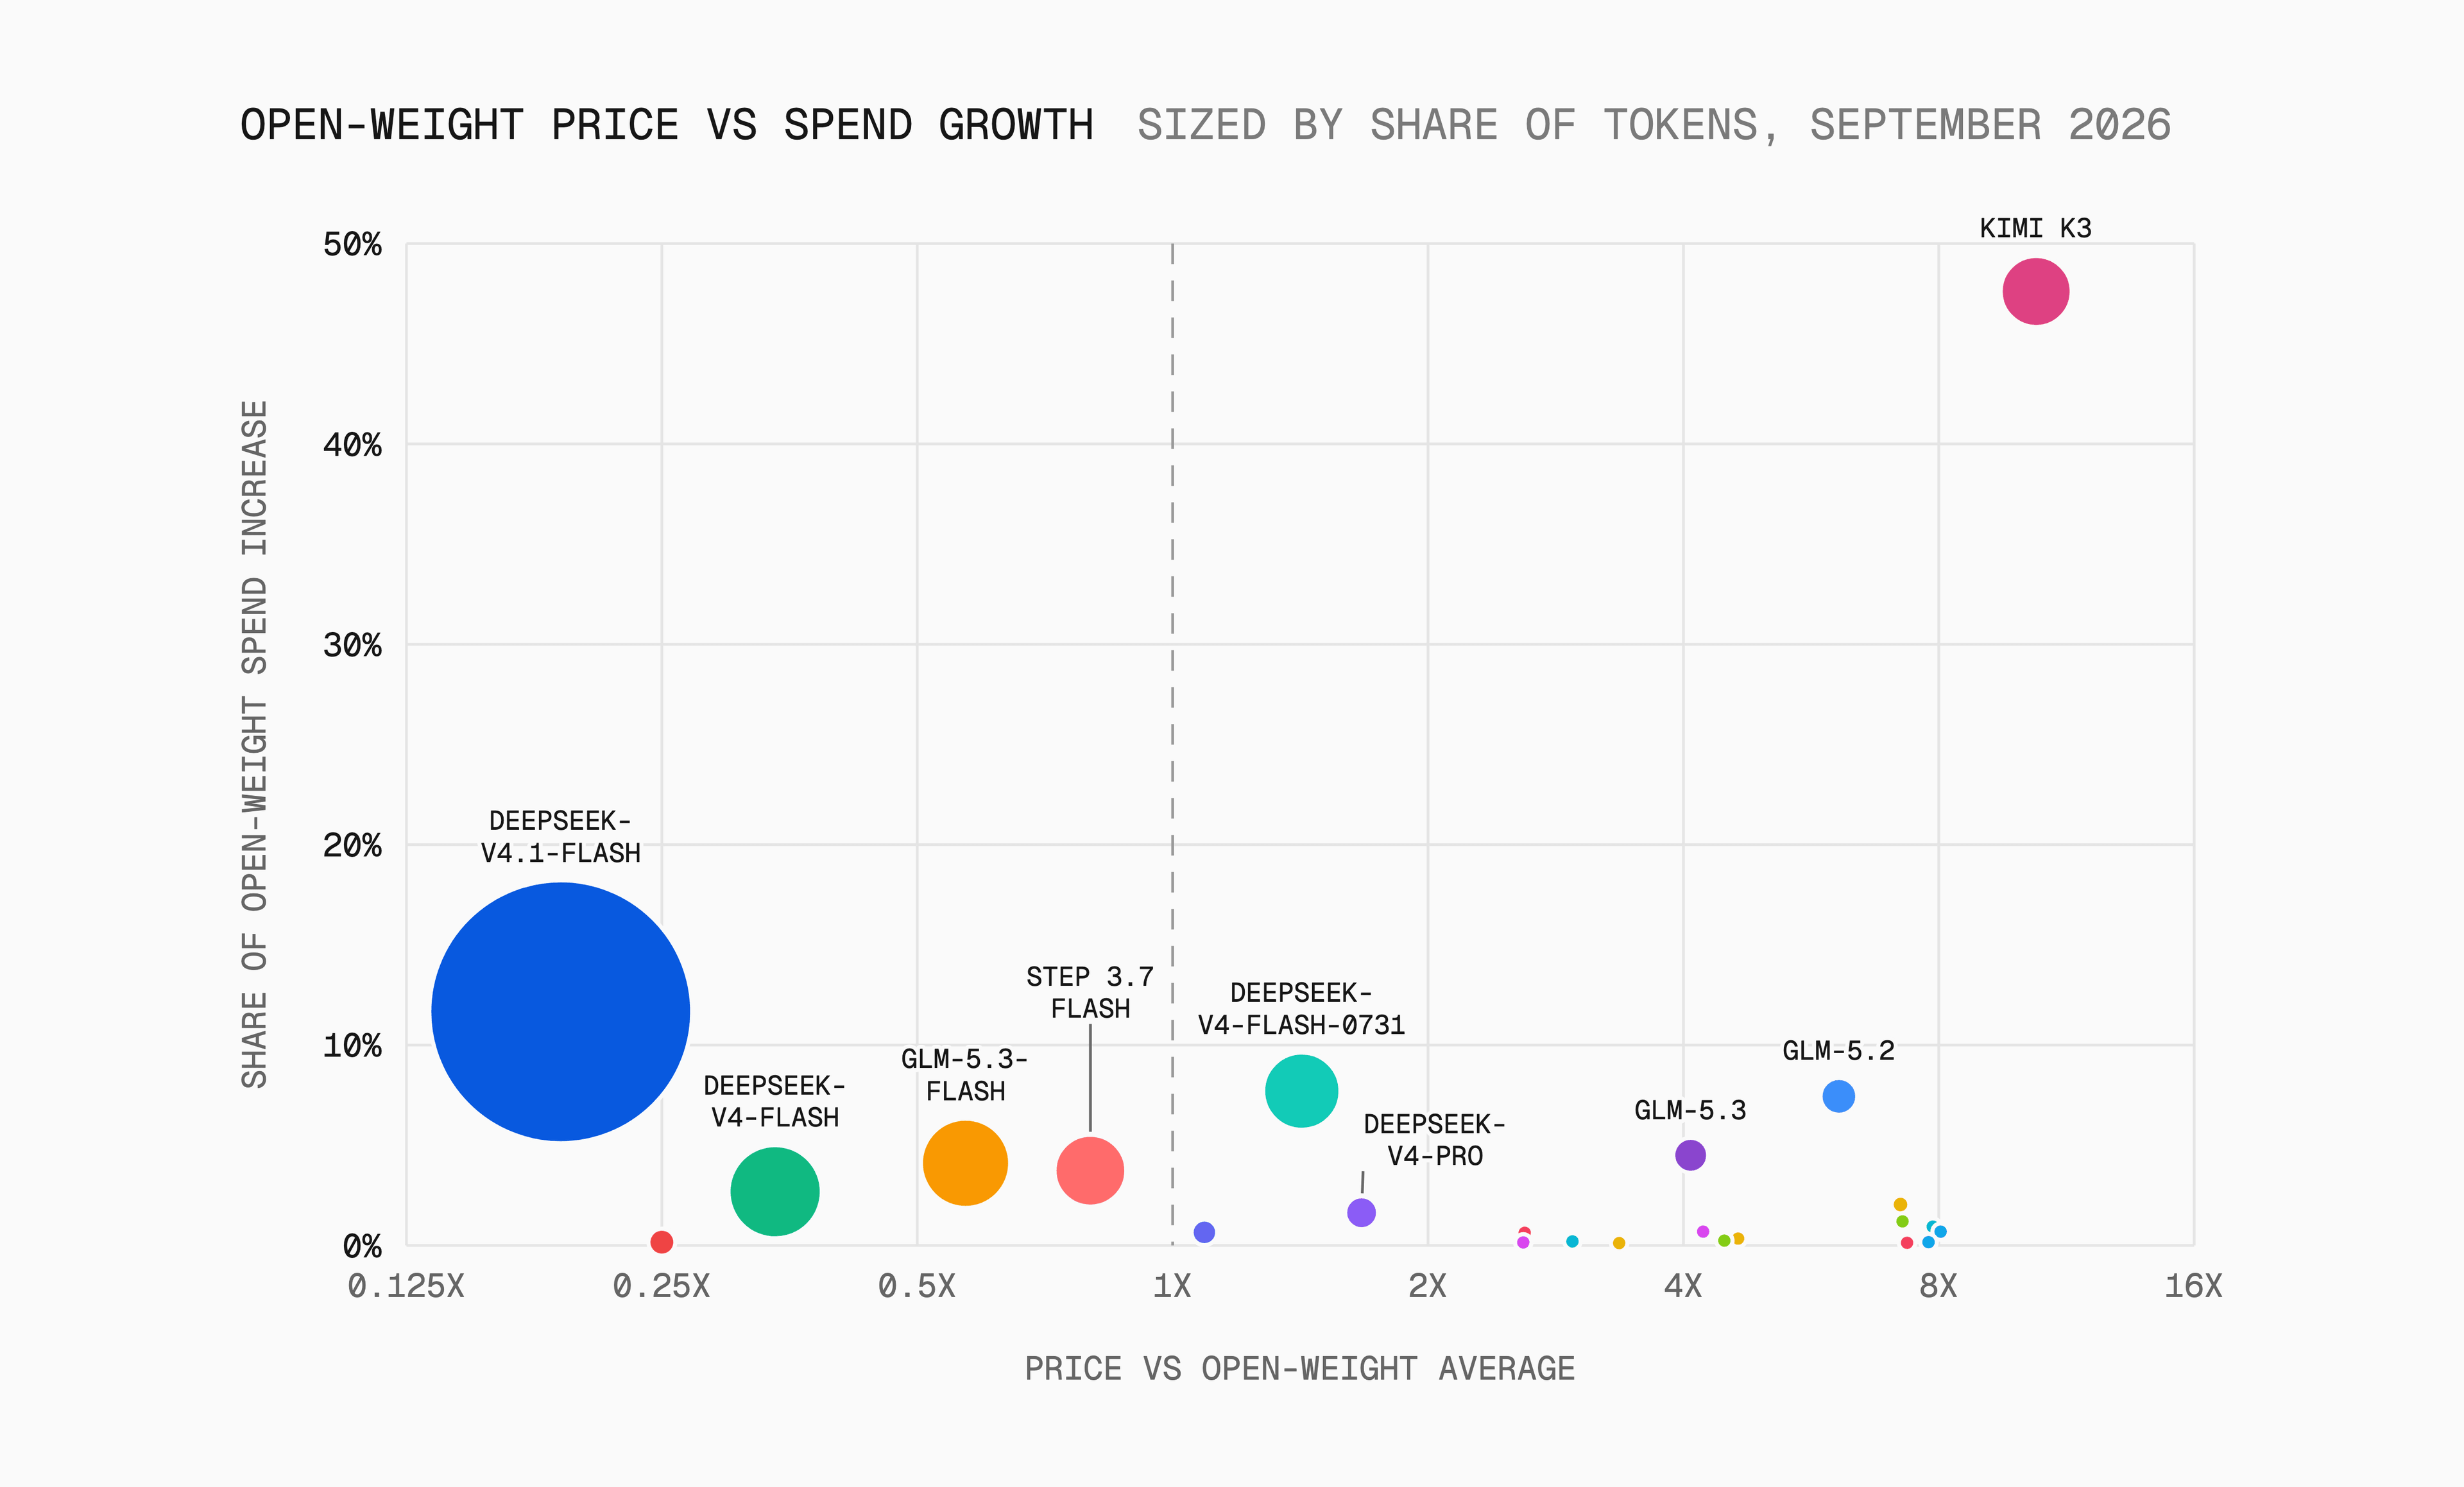
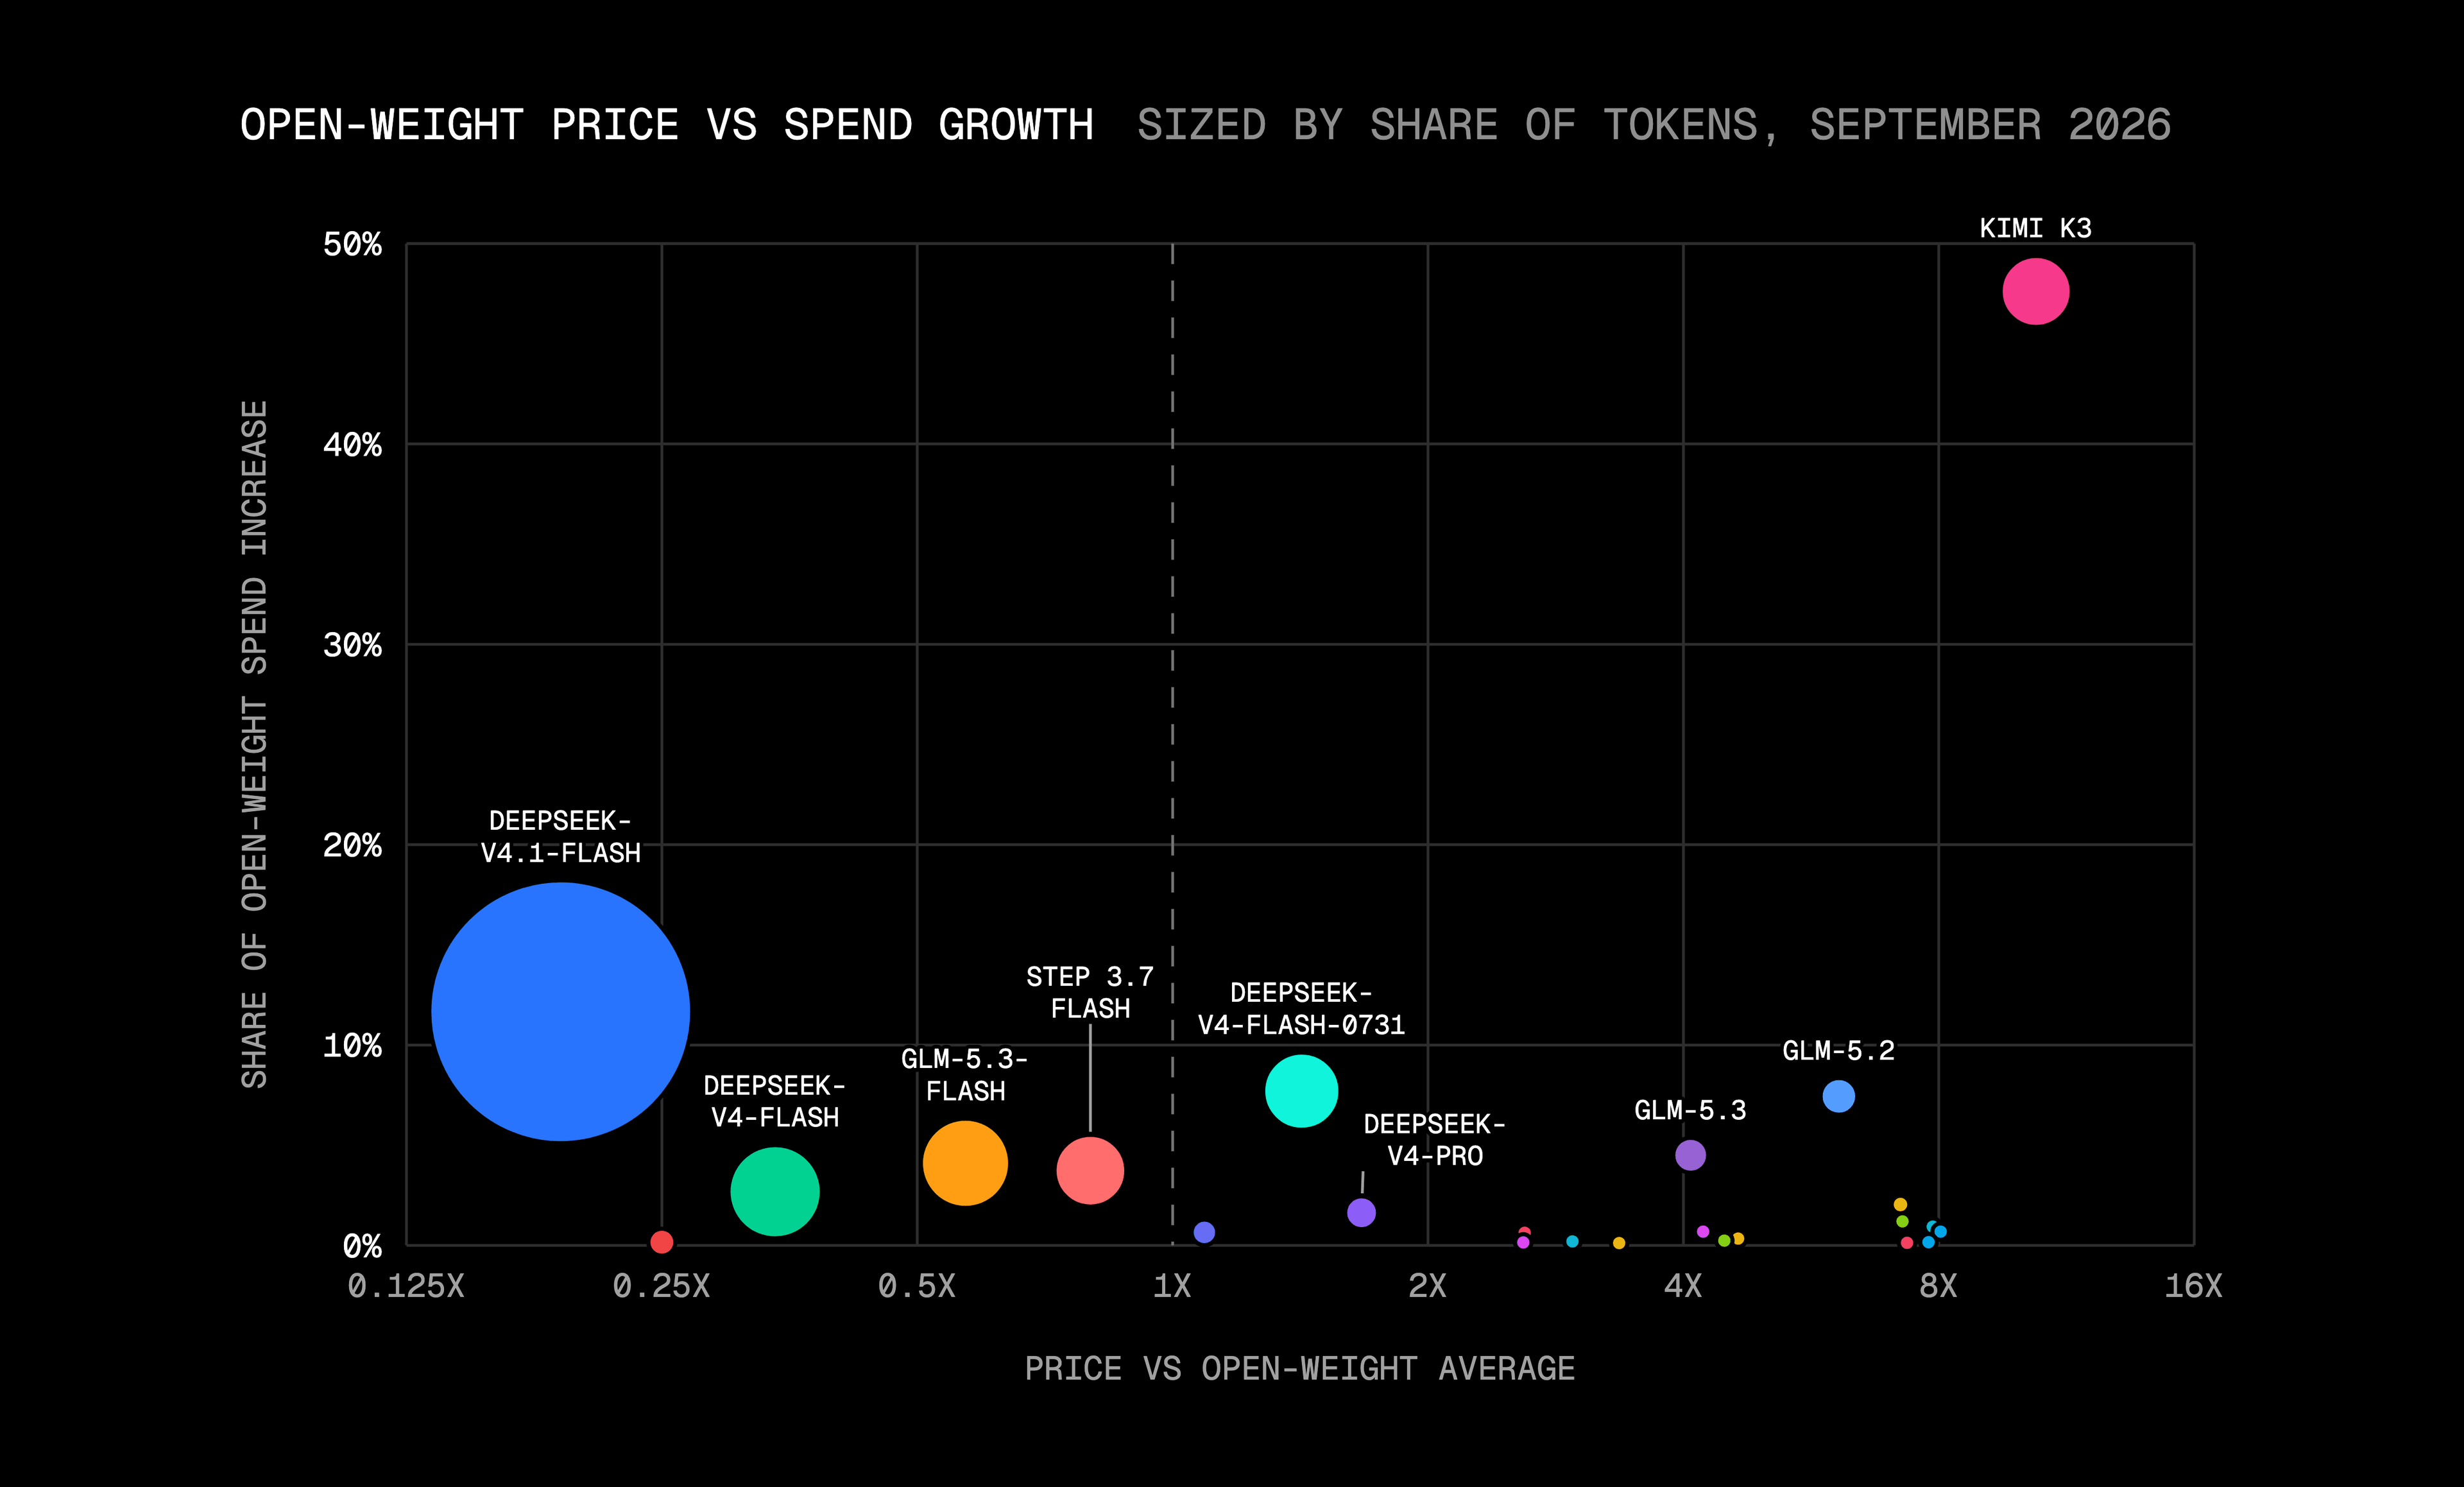
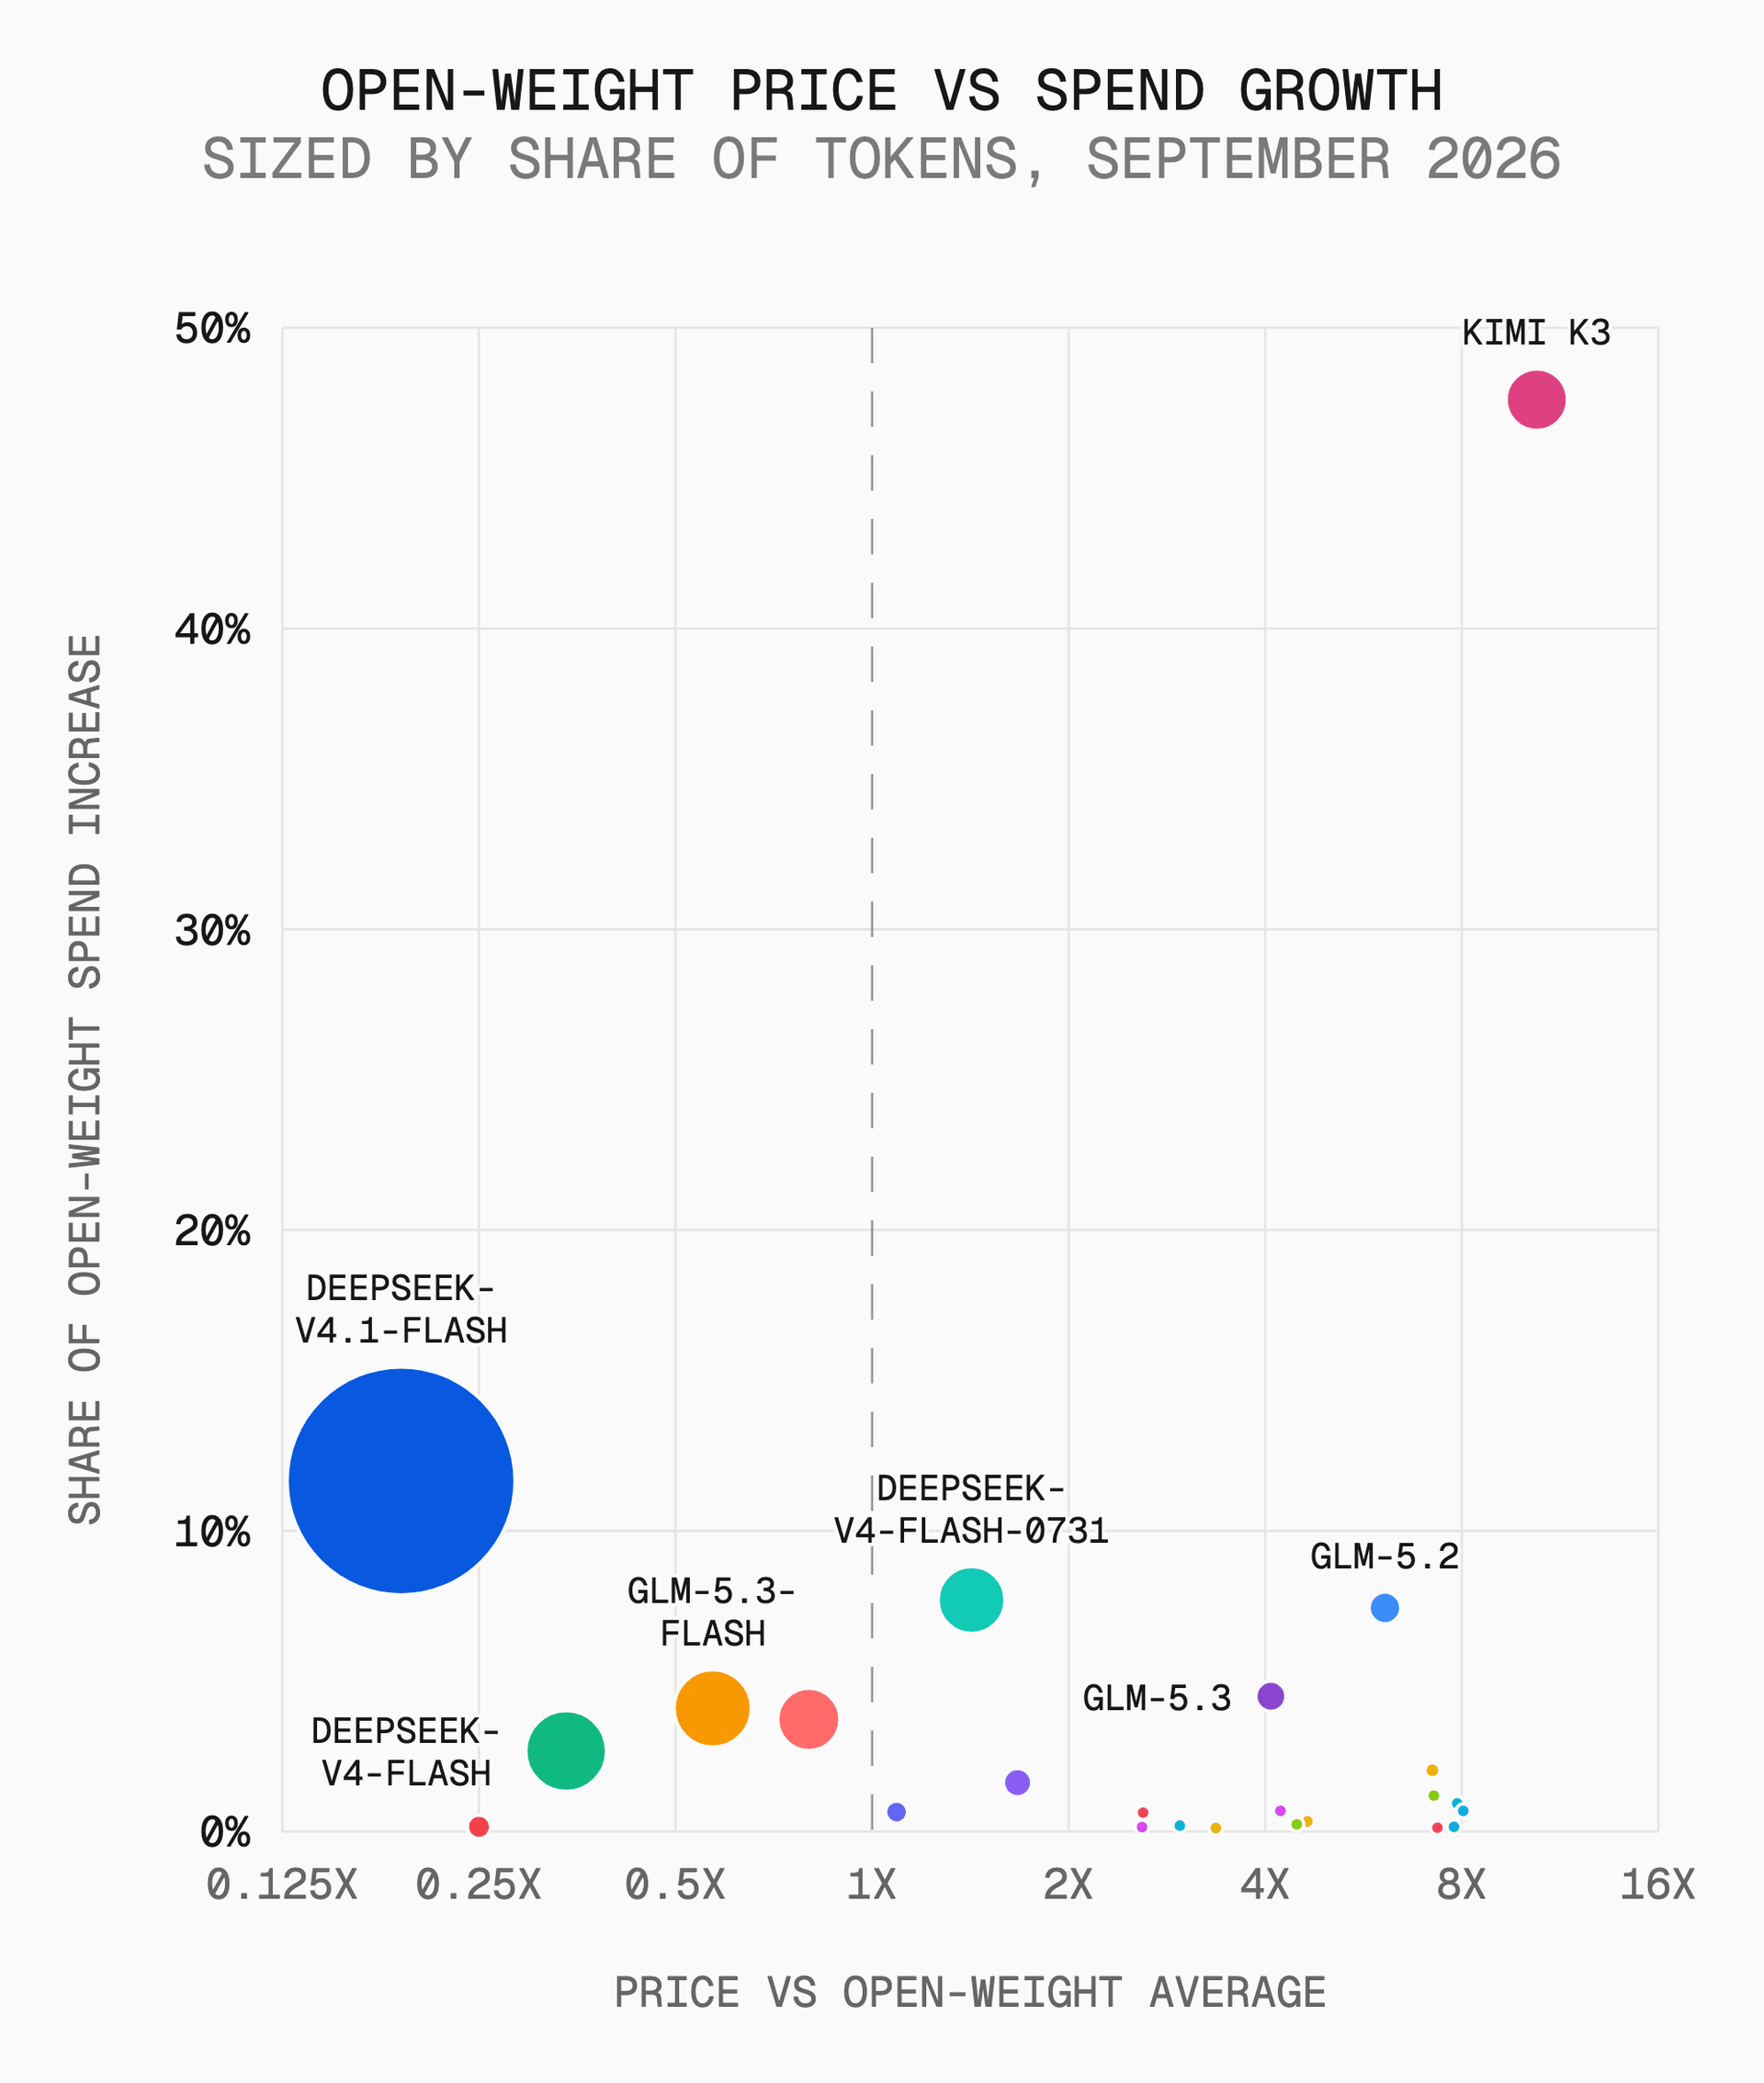
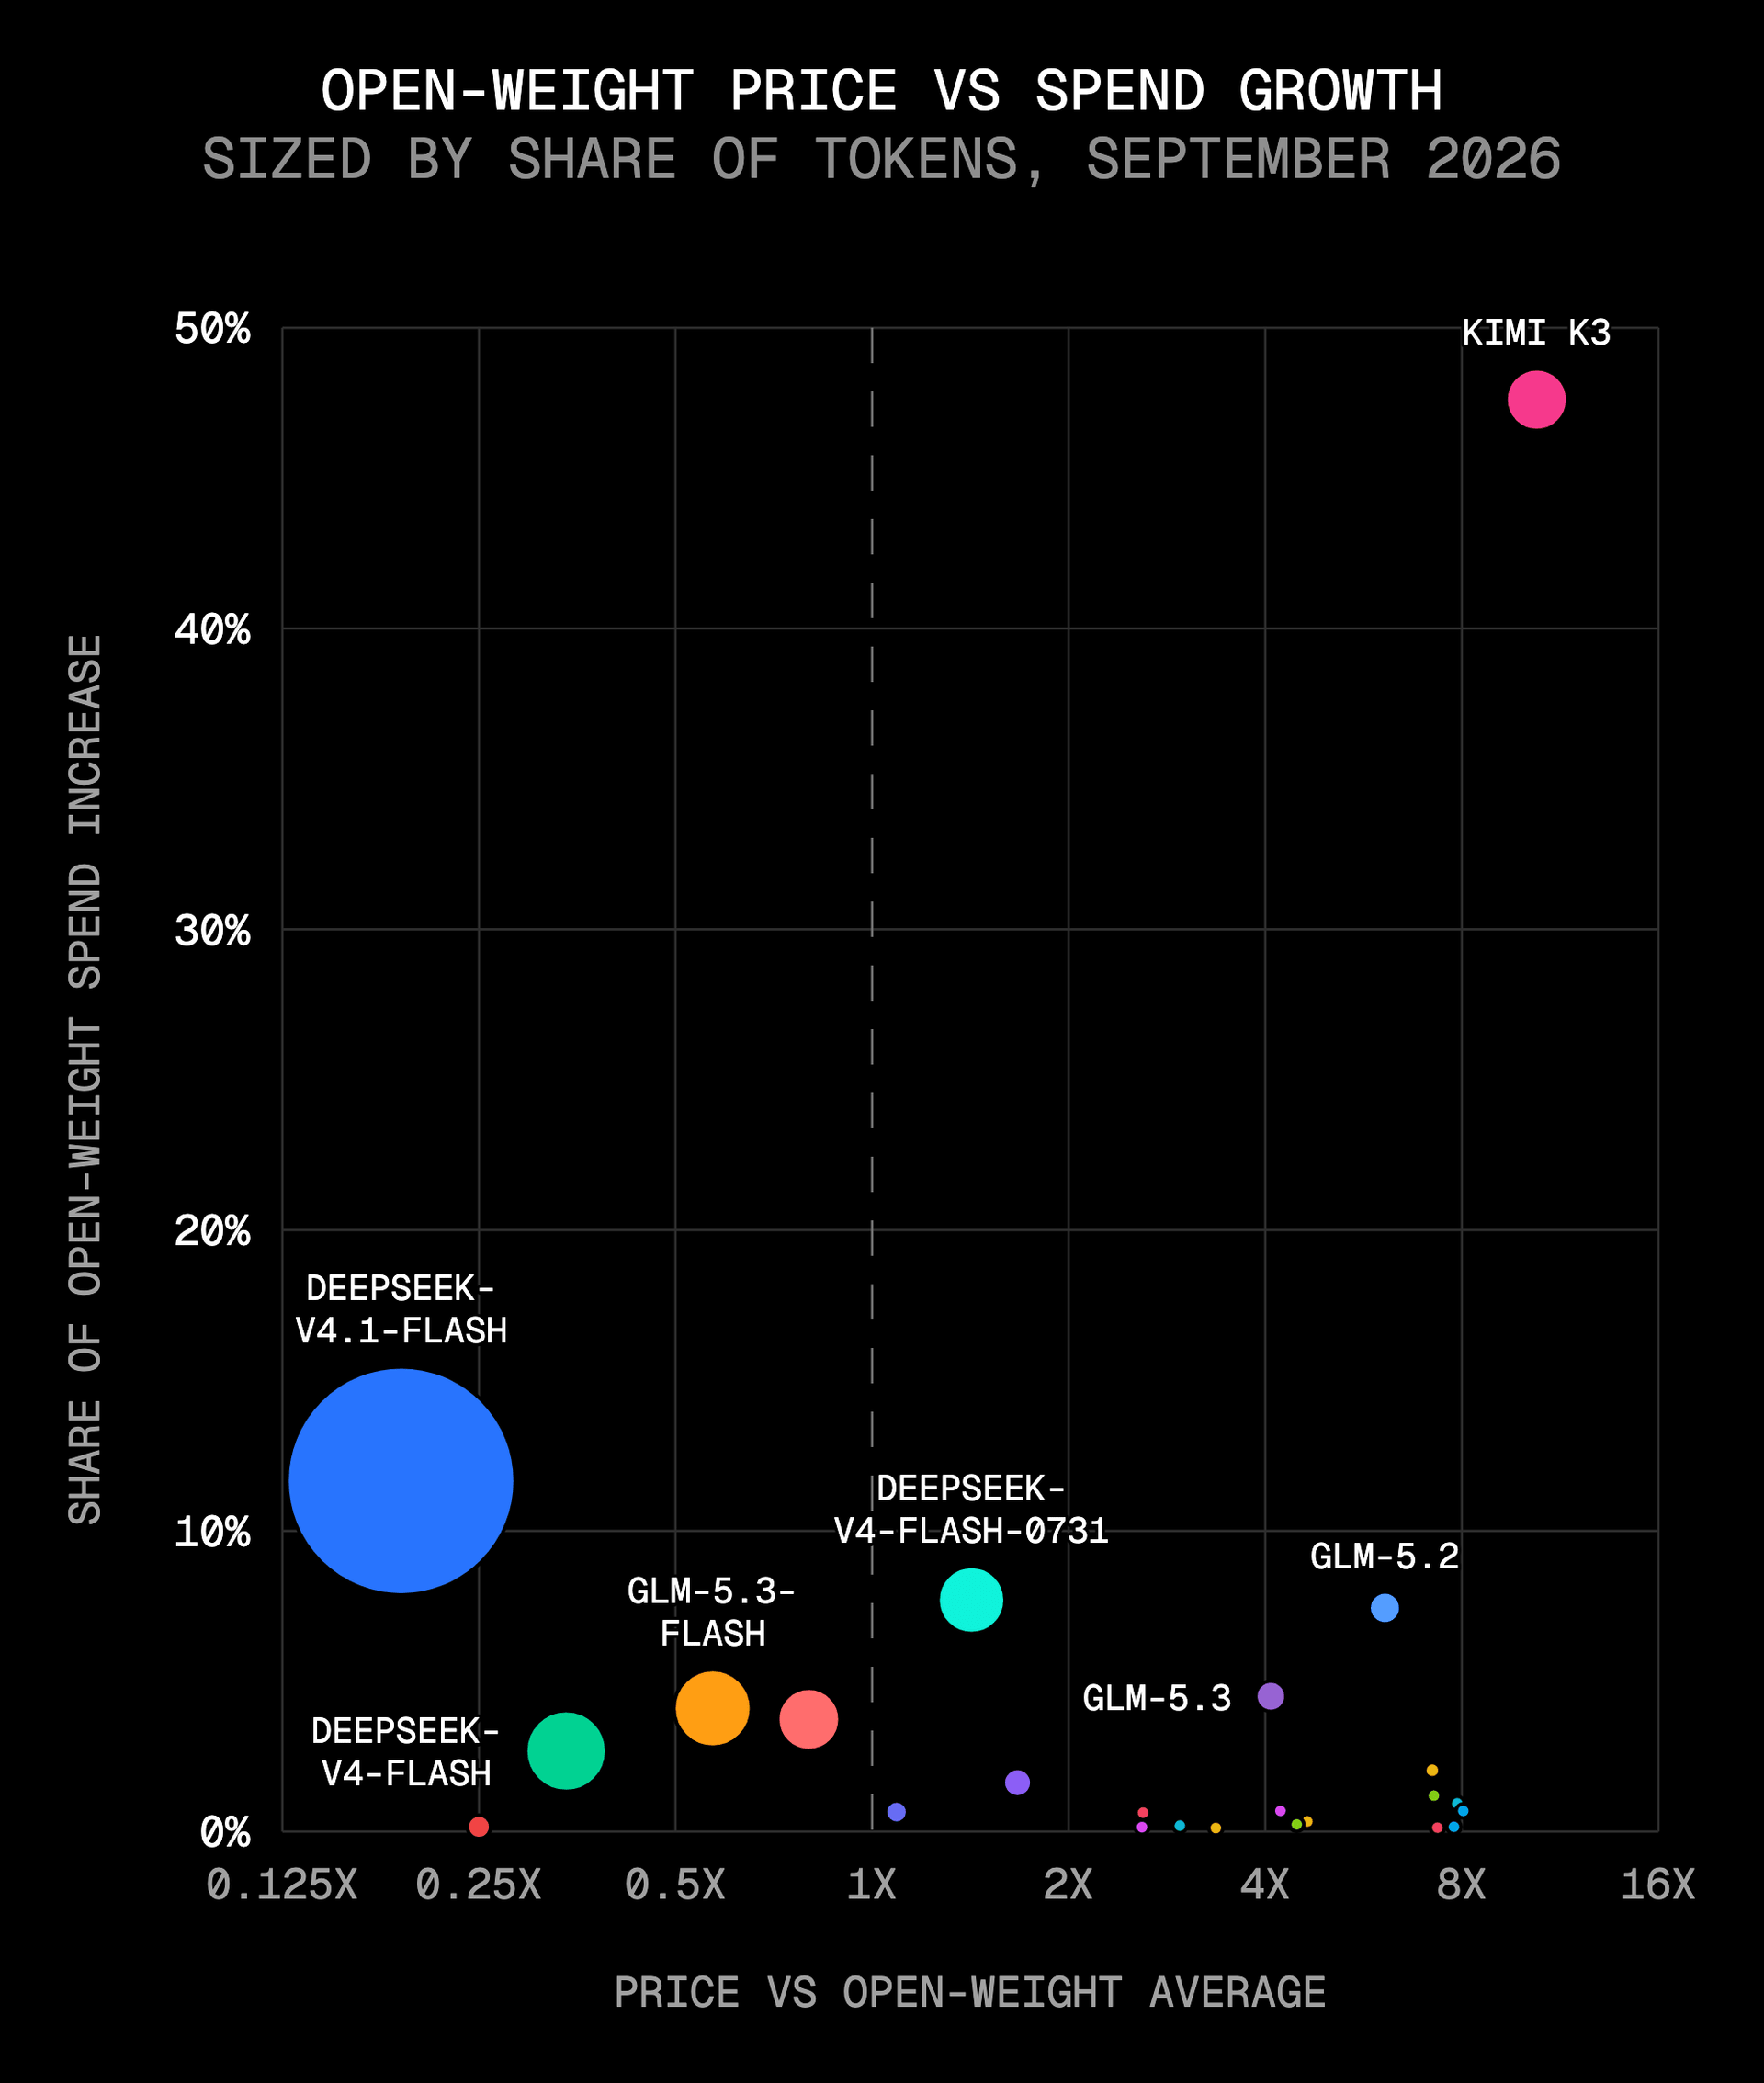
Customers are increasing budgets on both sides of the market. Since December, spend on frontier models has grown tenfold; spend on open-weight models has grown more than seventyfold.
In September, 68% of teams that put more money into open-weight models did the same for closed-weight models. And more than two in five teams already paying for frontier models spent more on them than in August, the highest share this year.
Spending on the frontier is still growing, but spending on alternatives is growing faster. A company can spend more with a frontier lab while relying on it for fewer workloads, so the lab gets more money, but a smaller part of the customer’s business.
Copy link to headingAI spend increases 13x while the cost per token halves
Market share is changing hands inside a market that is getting much bigger and cheaper.
September's gateway spend was about 13 times December's, an increase of 1,180%, while the average price per token fell 47%. The median paid customer active in both December and September more than doubled its spend.
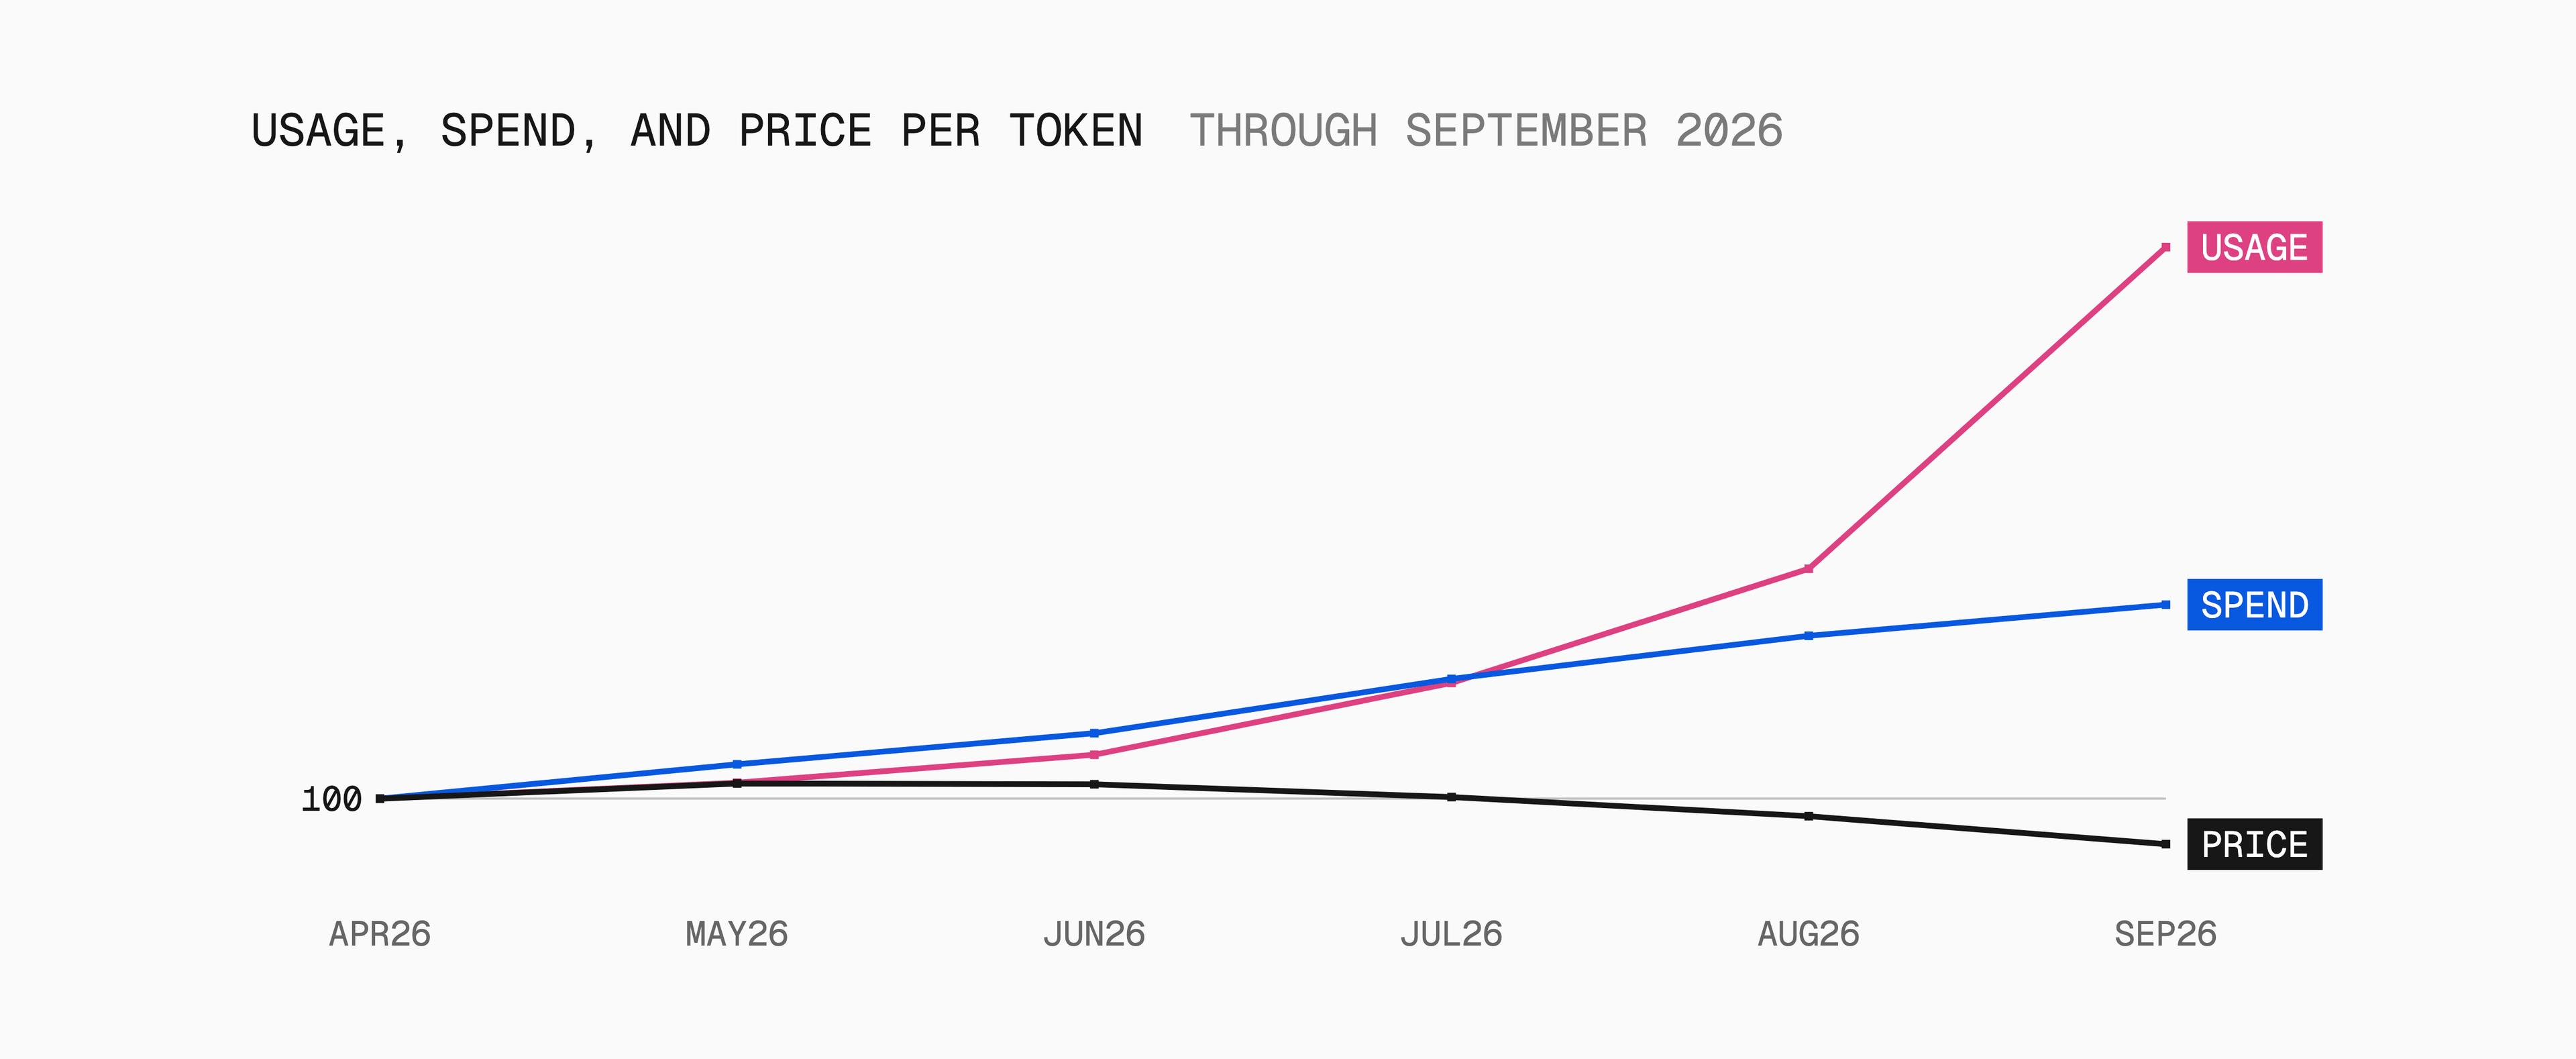
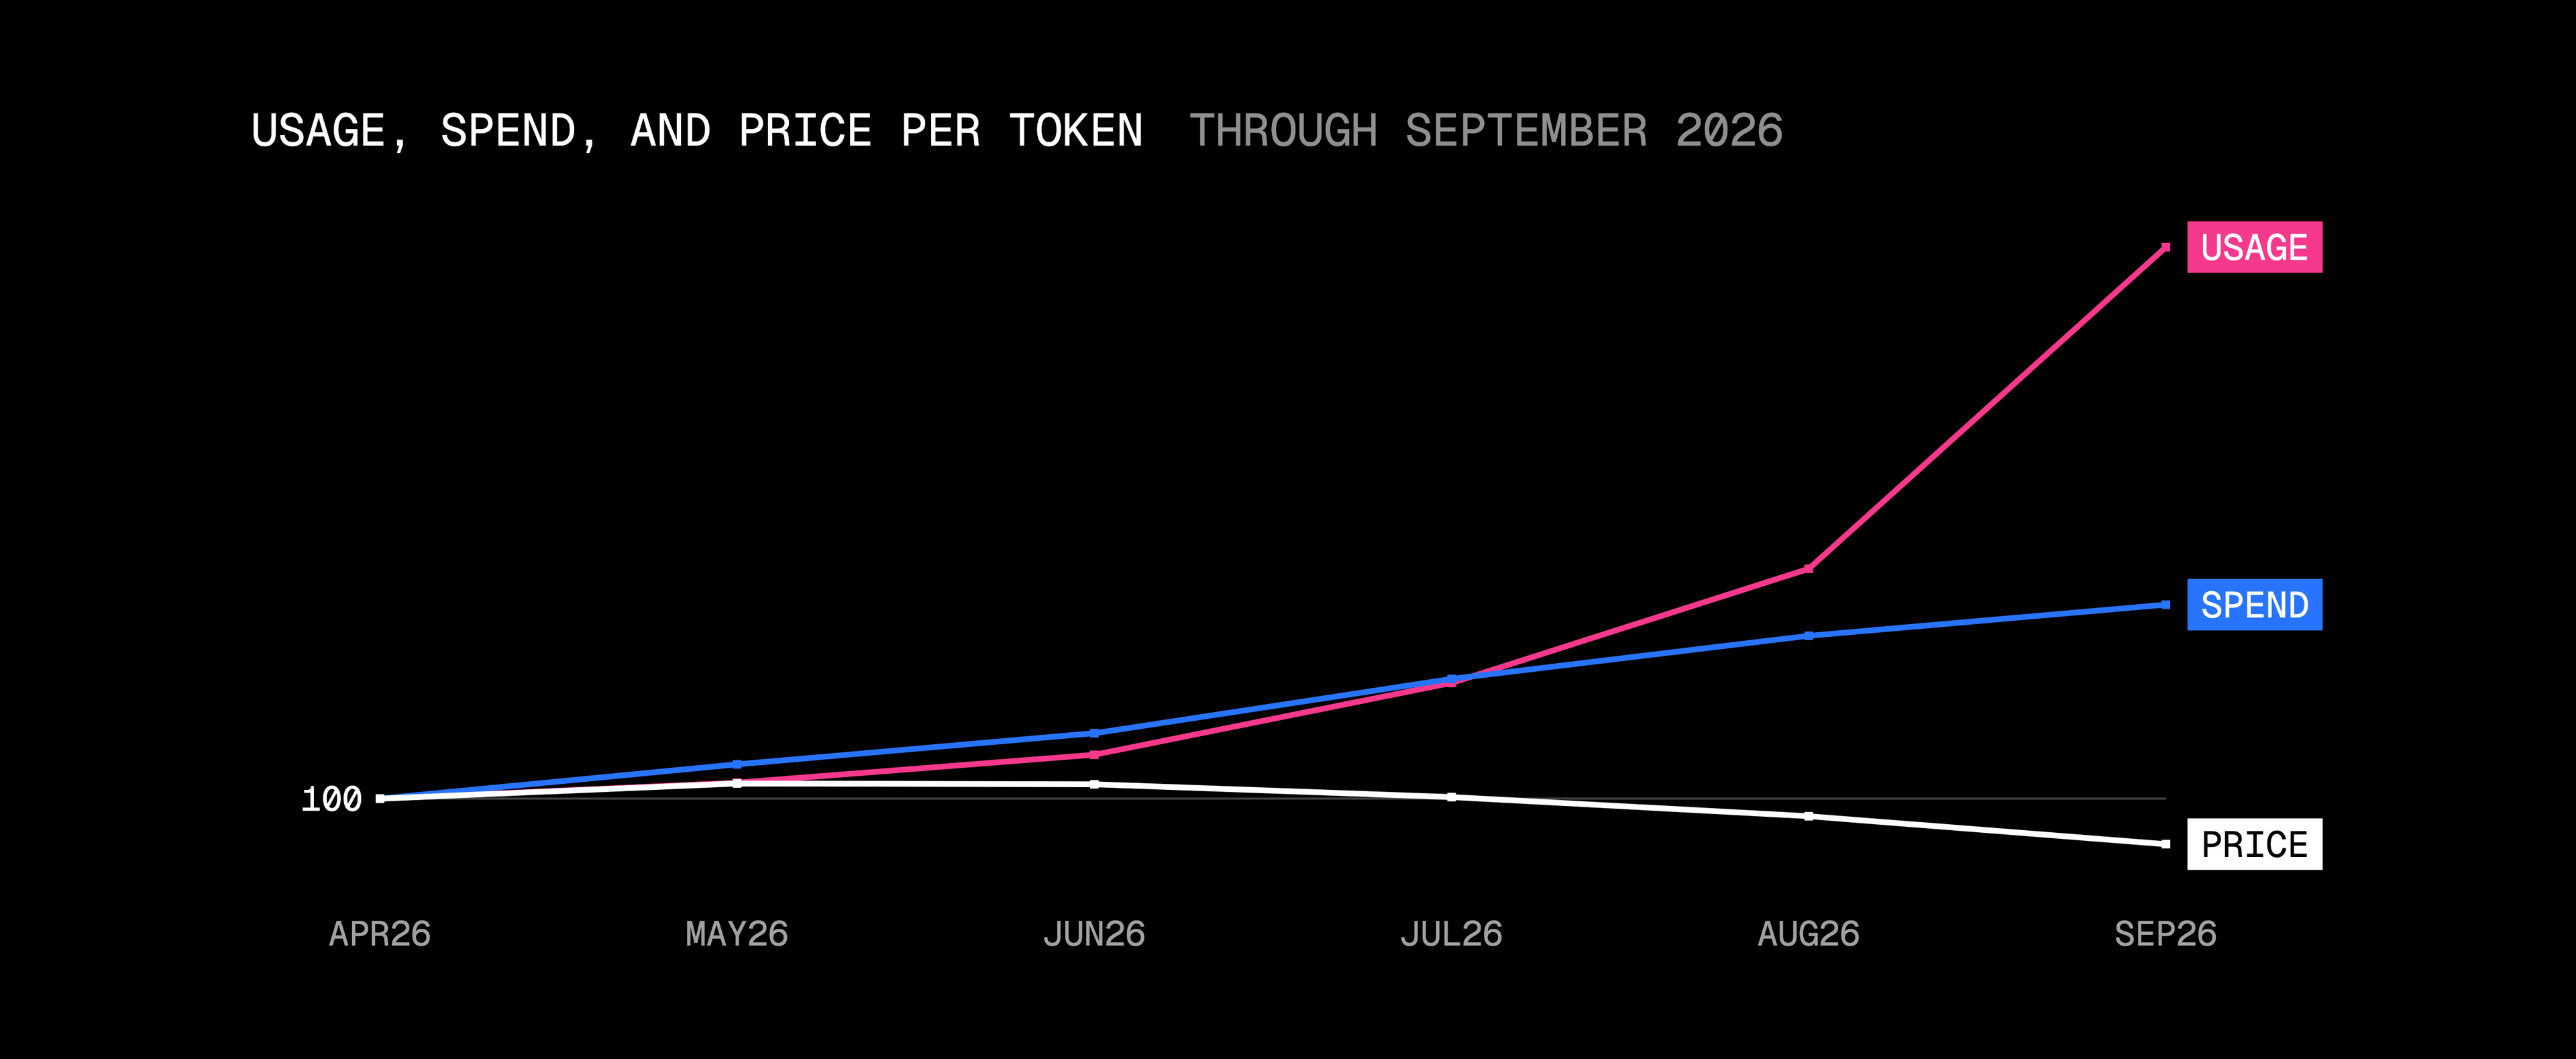
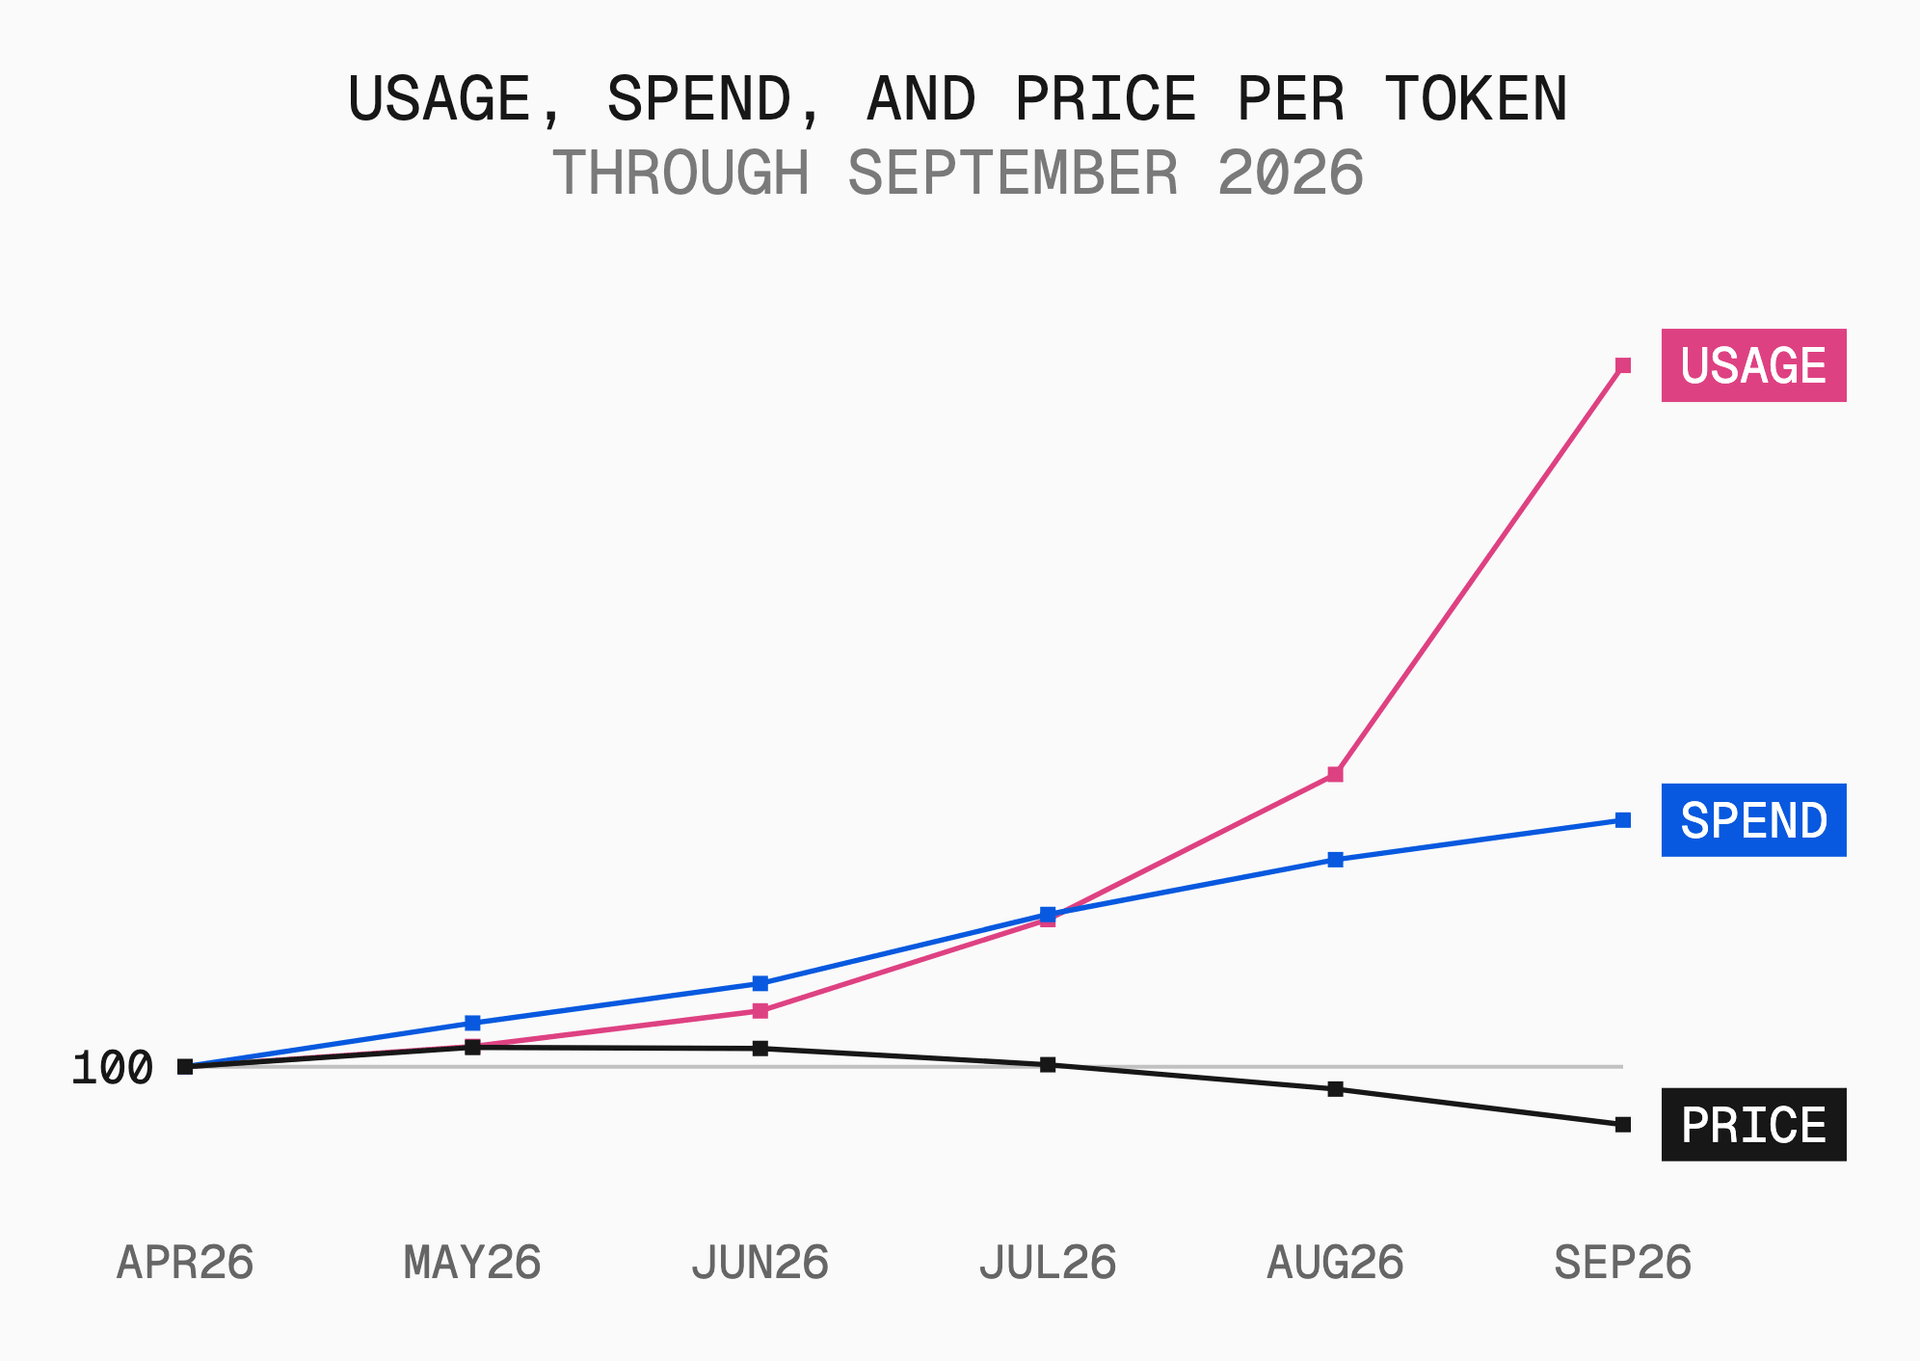
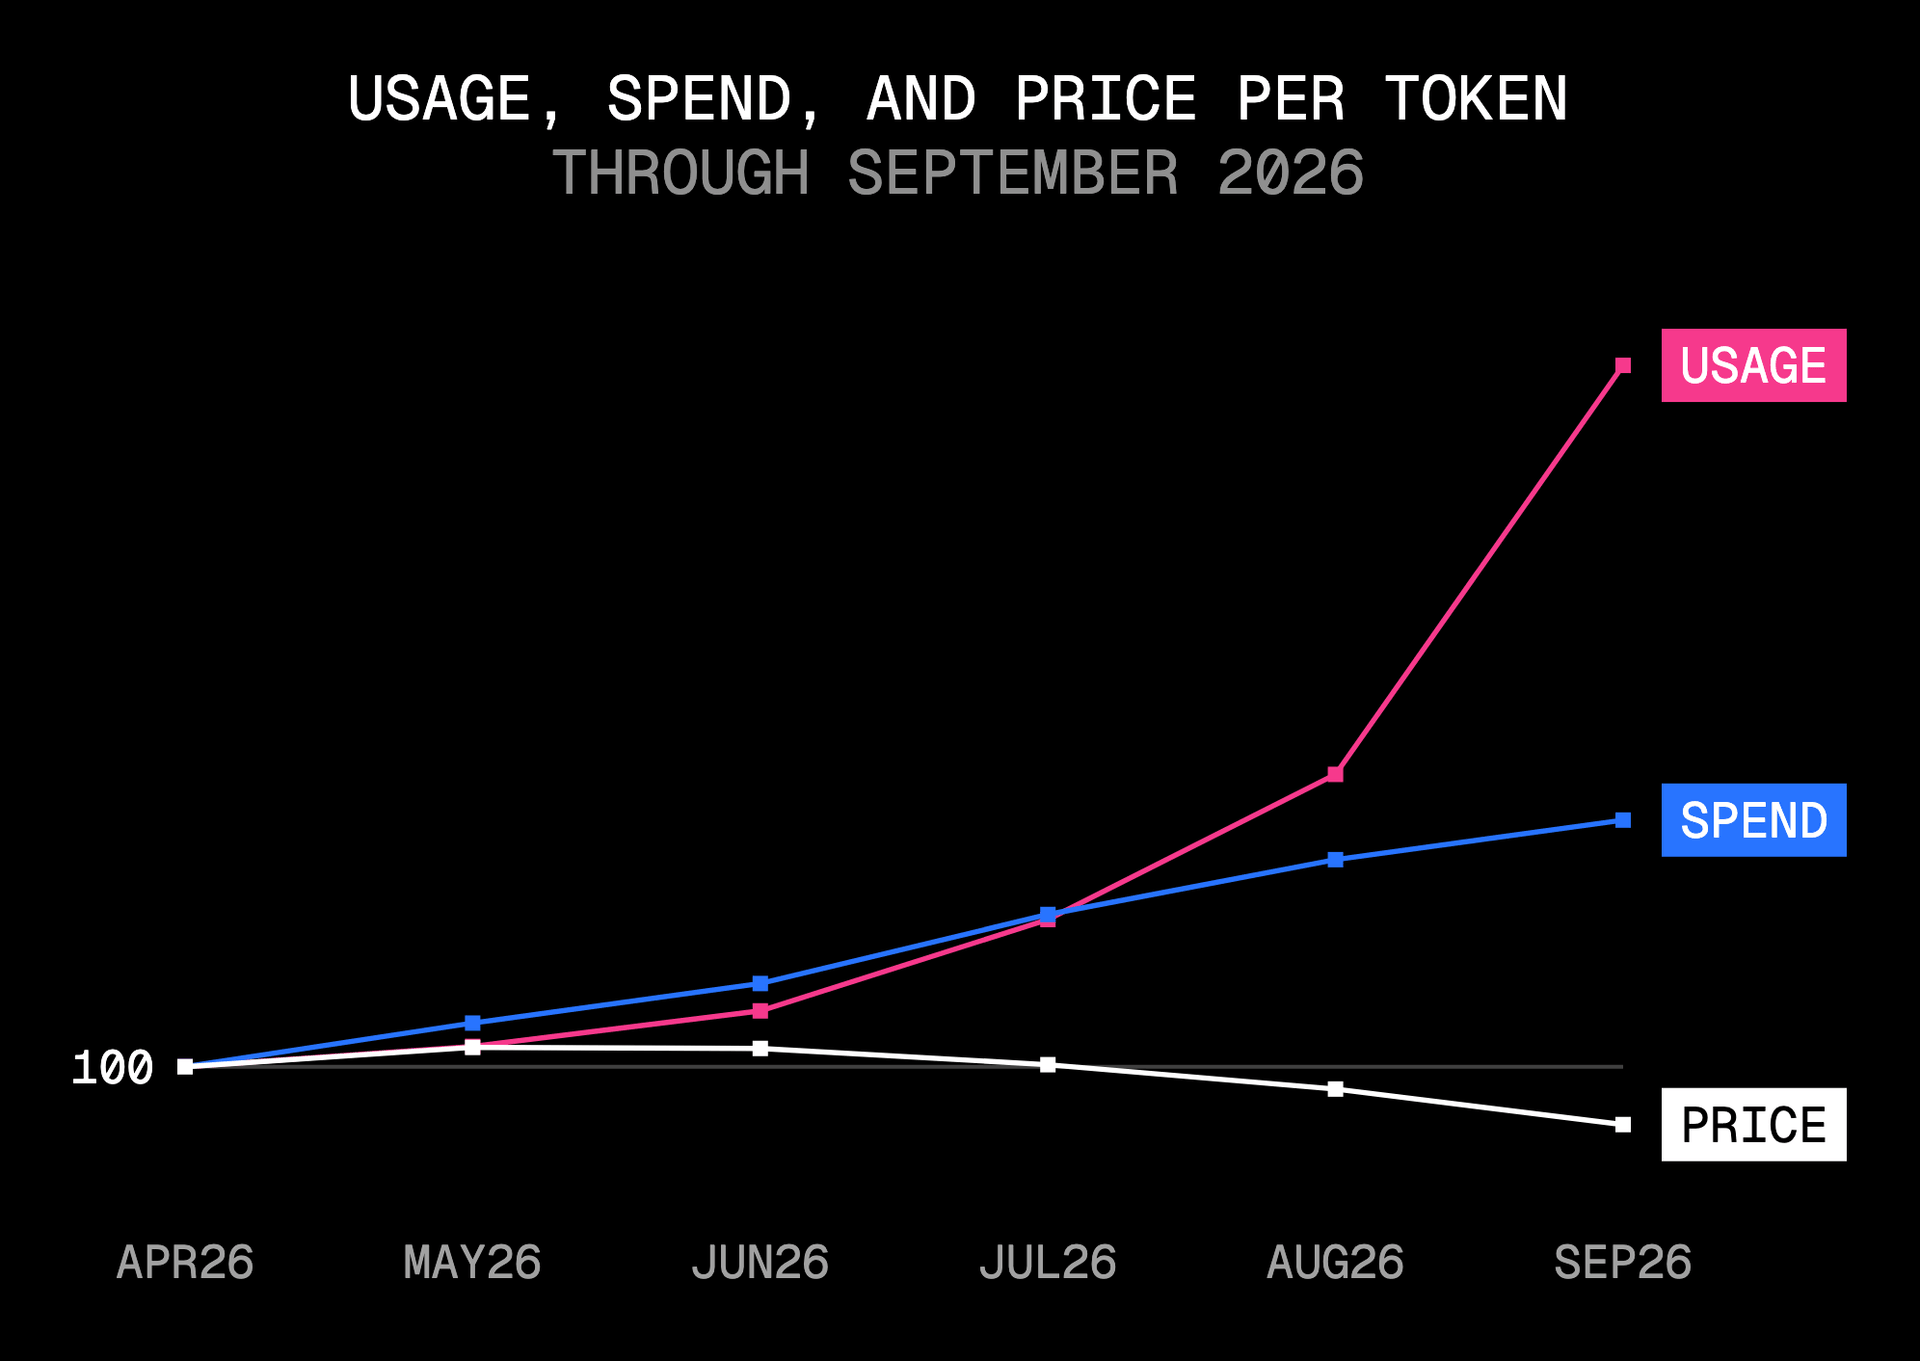
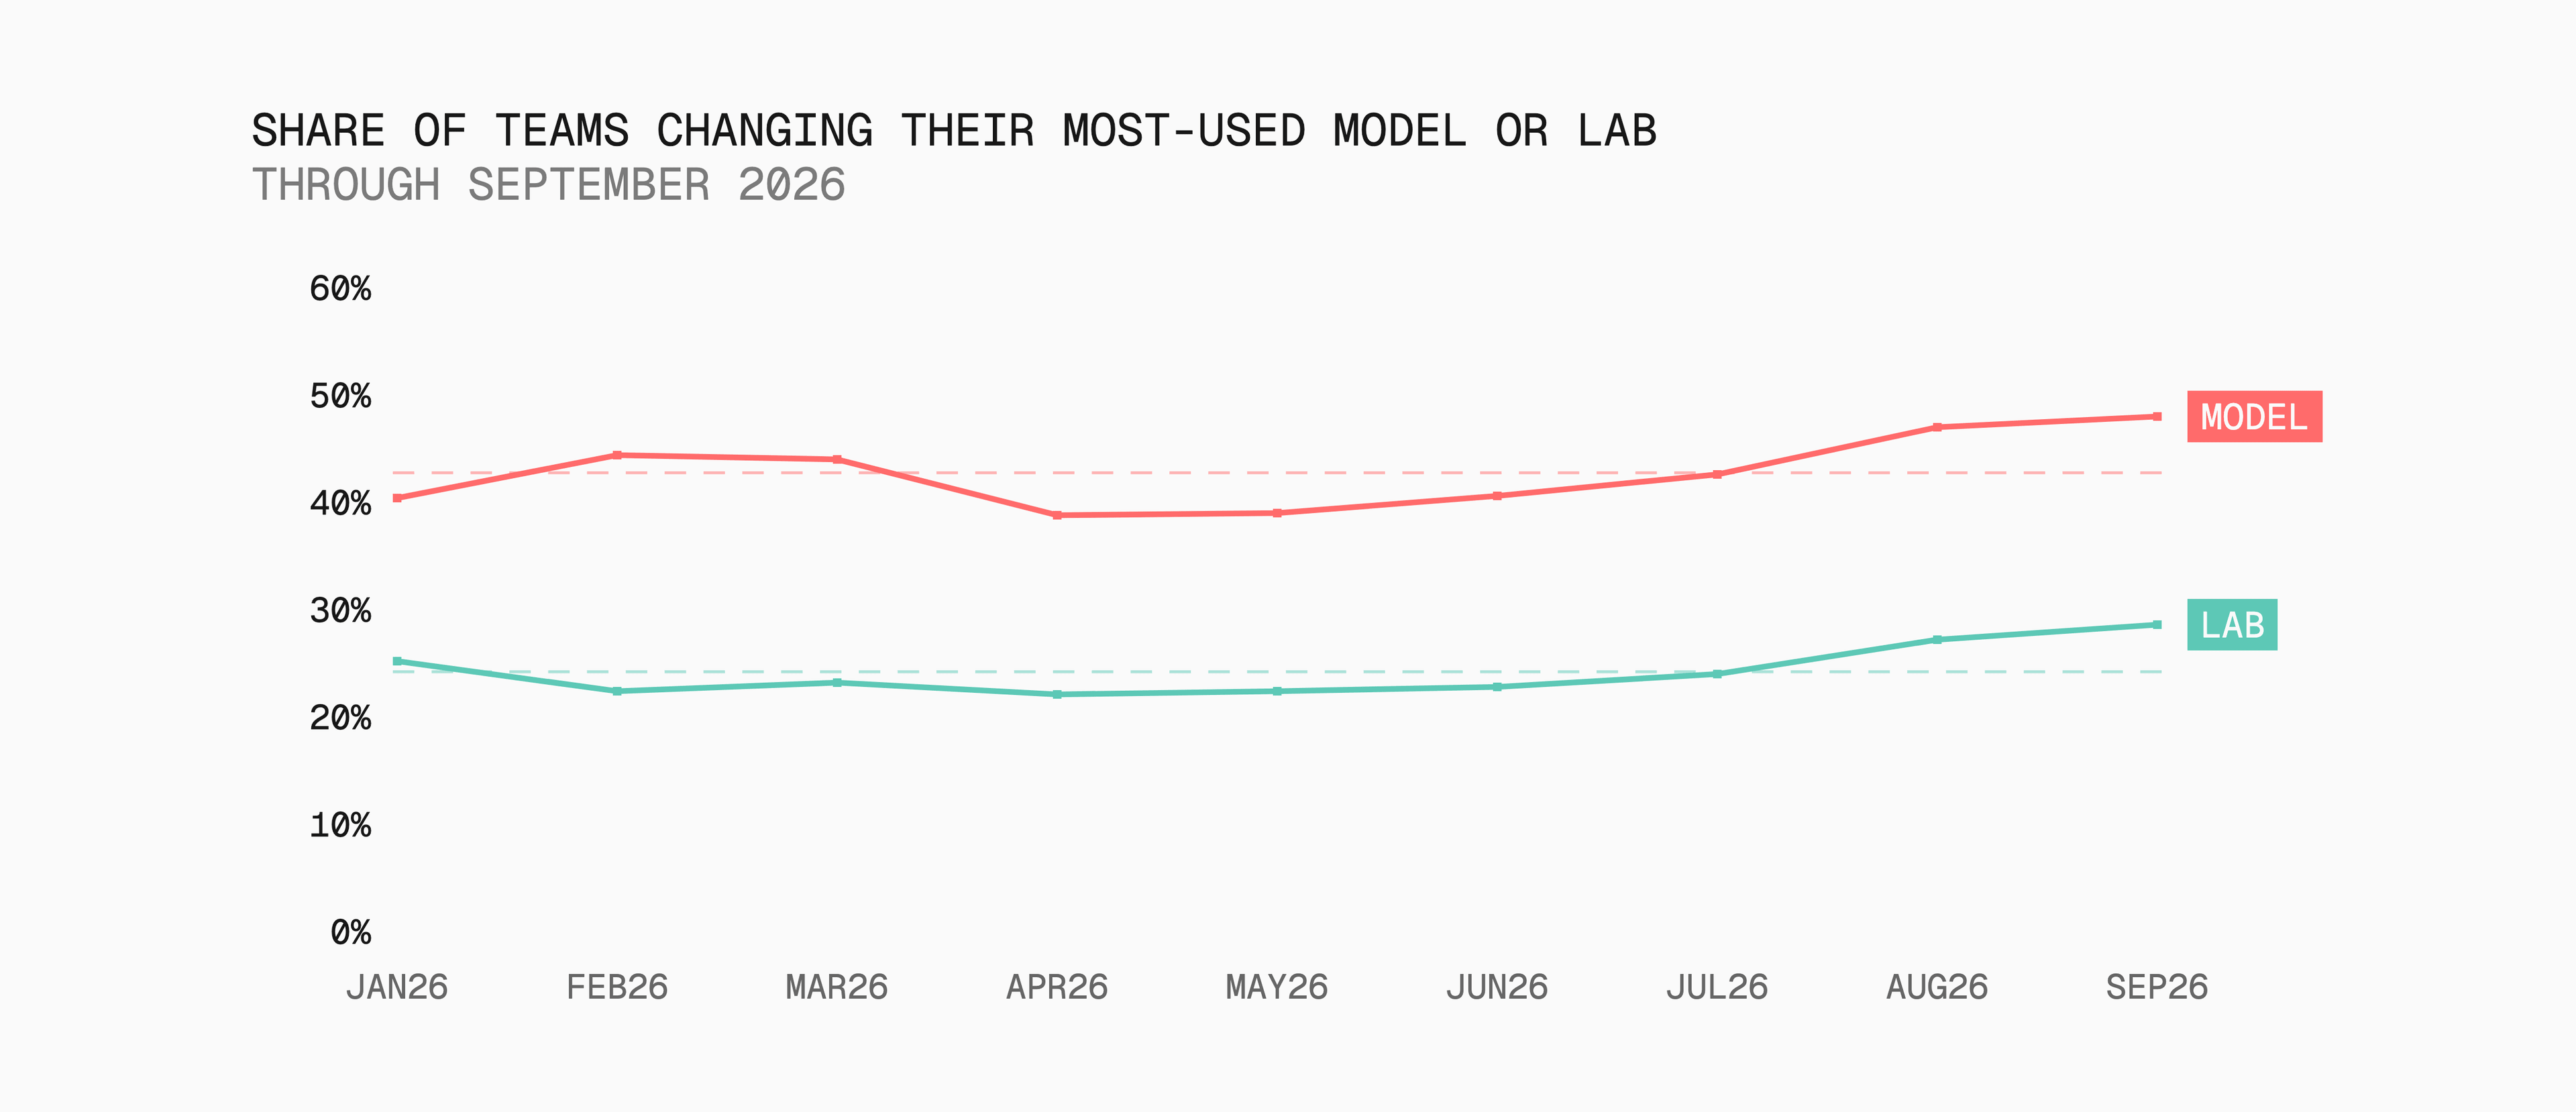
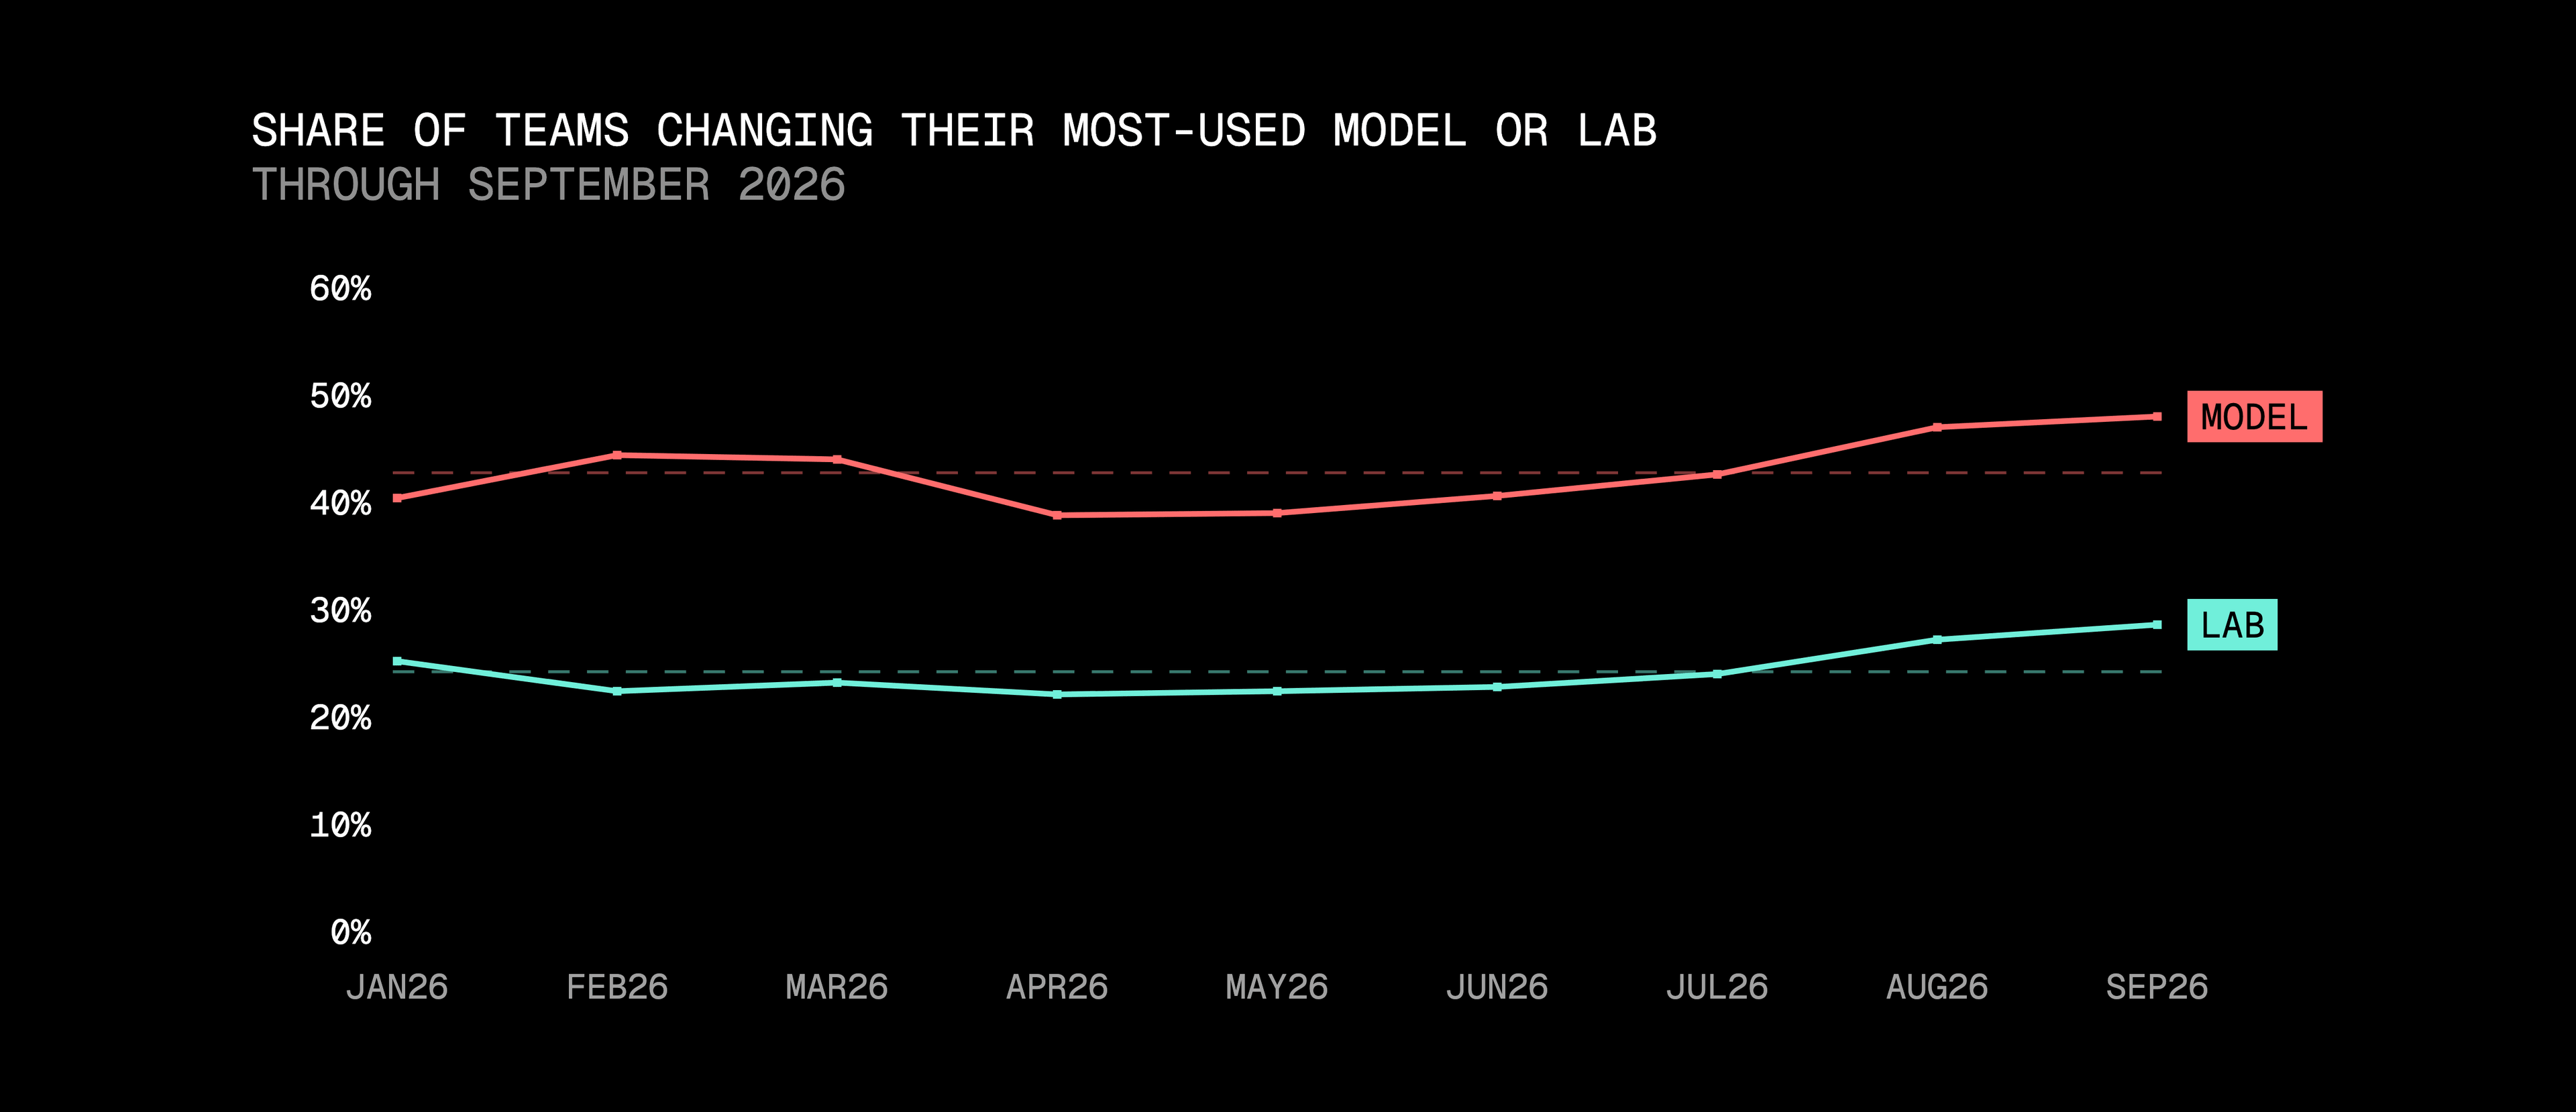
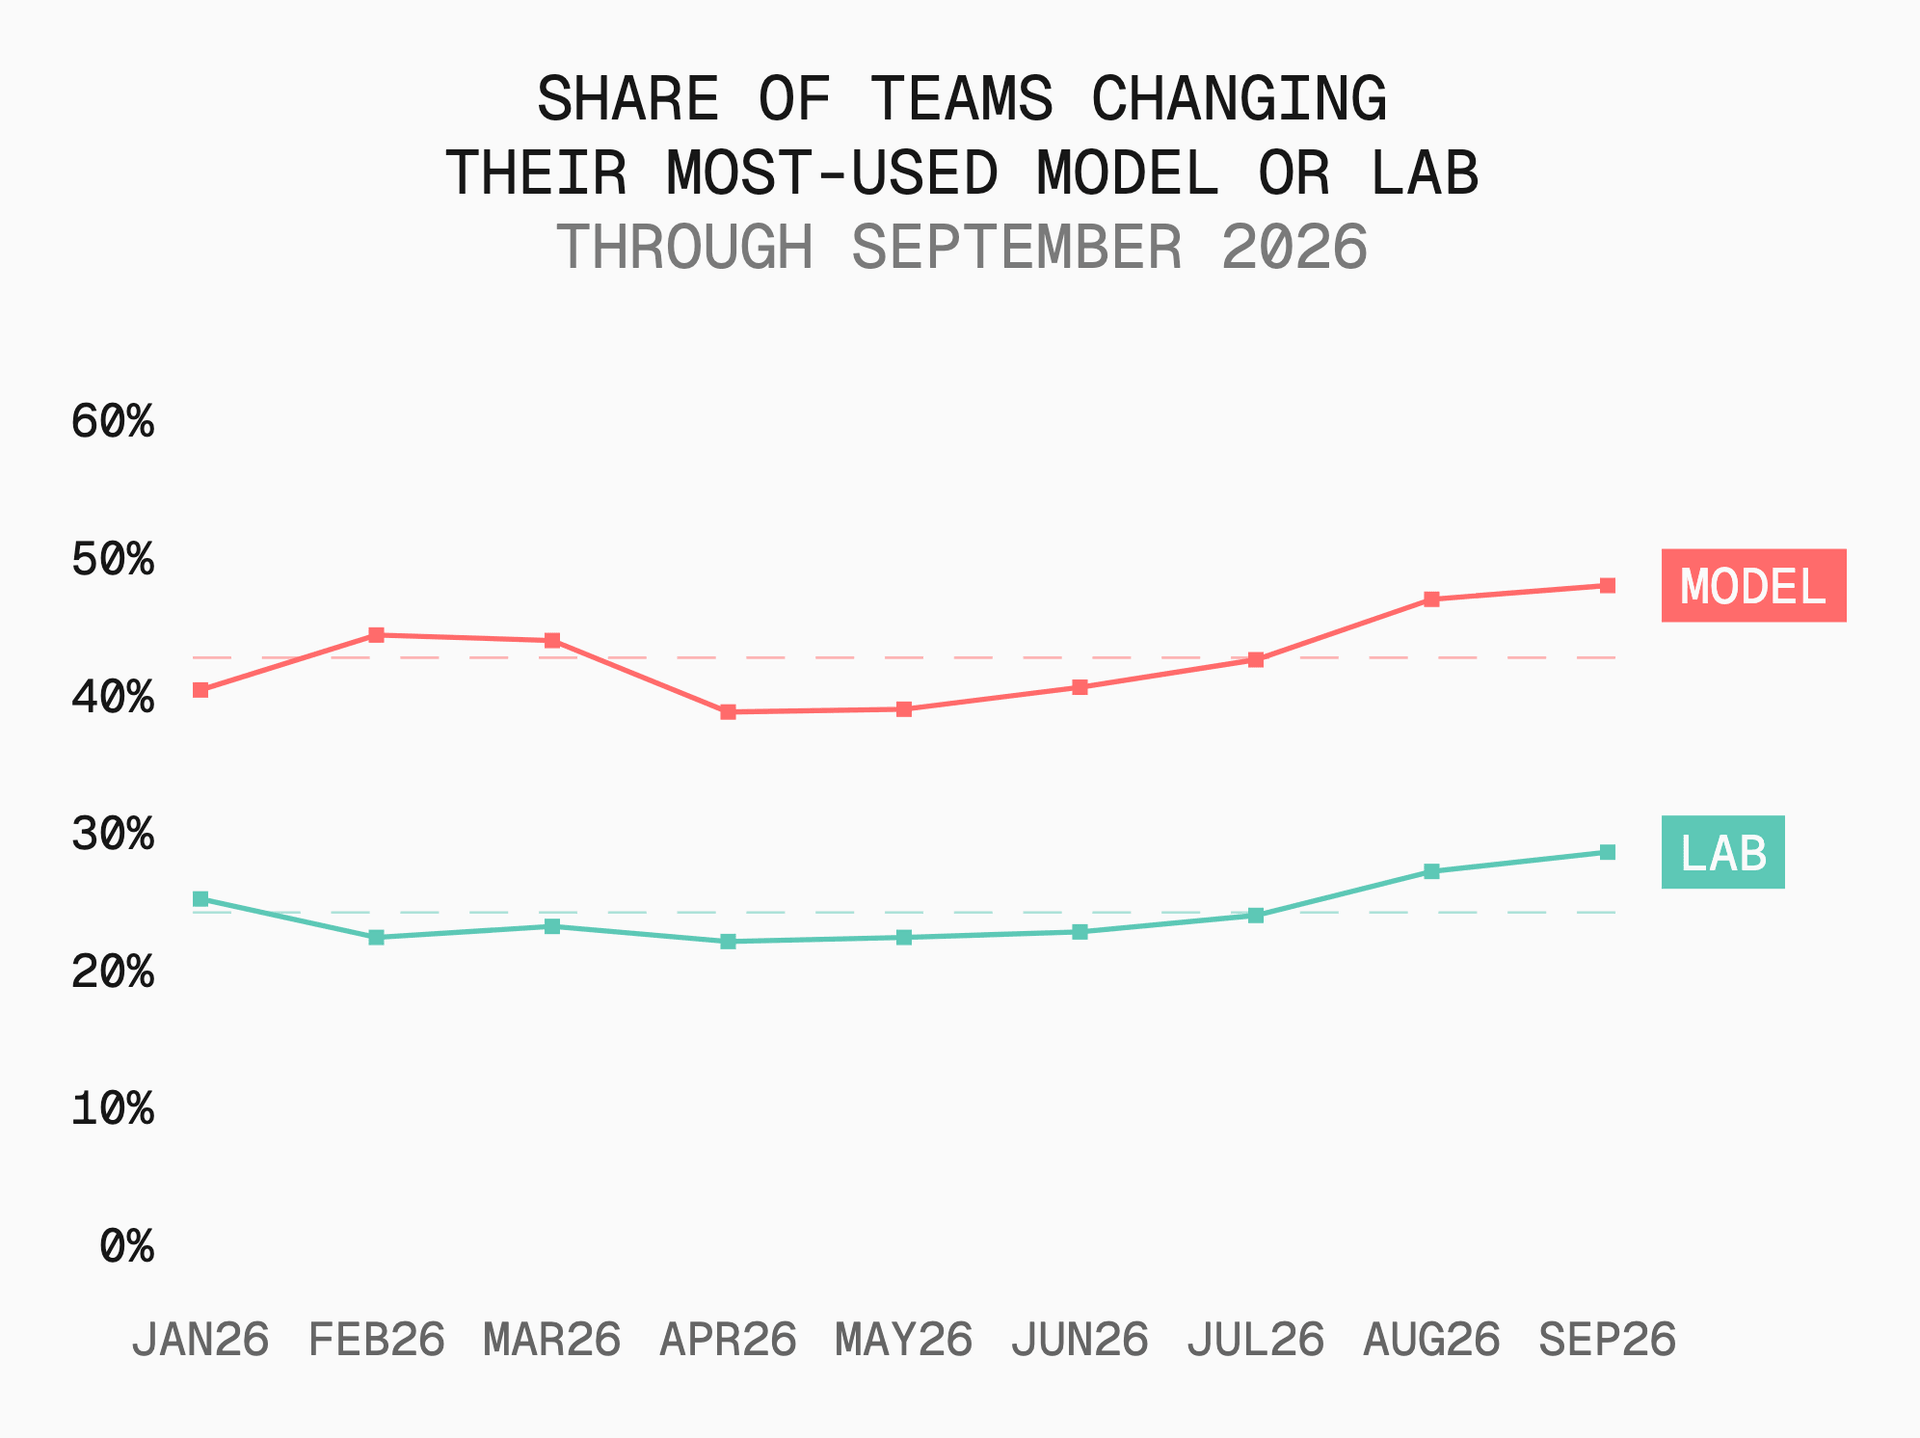
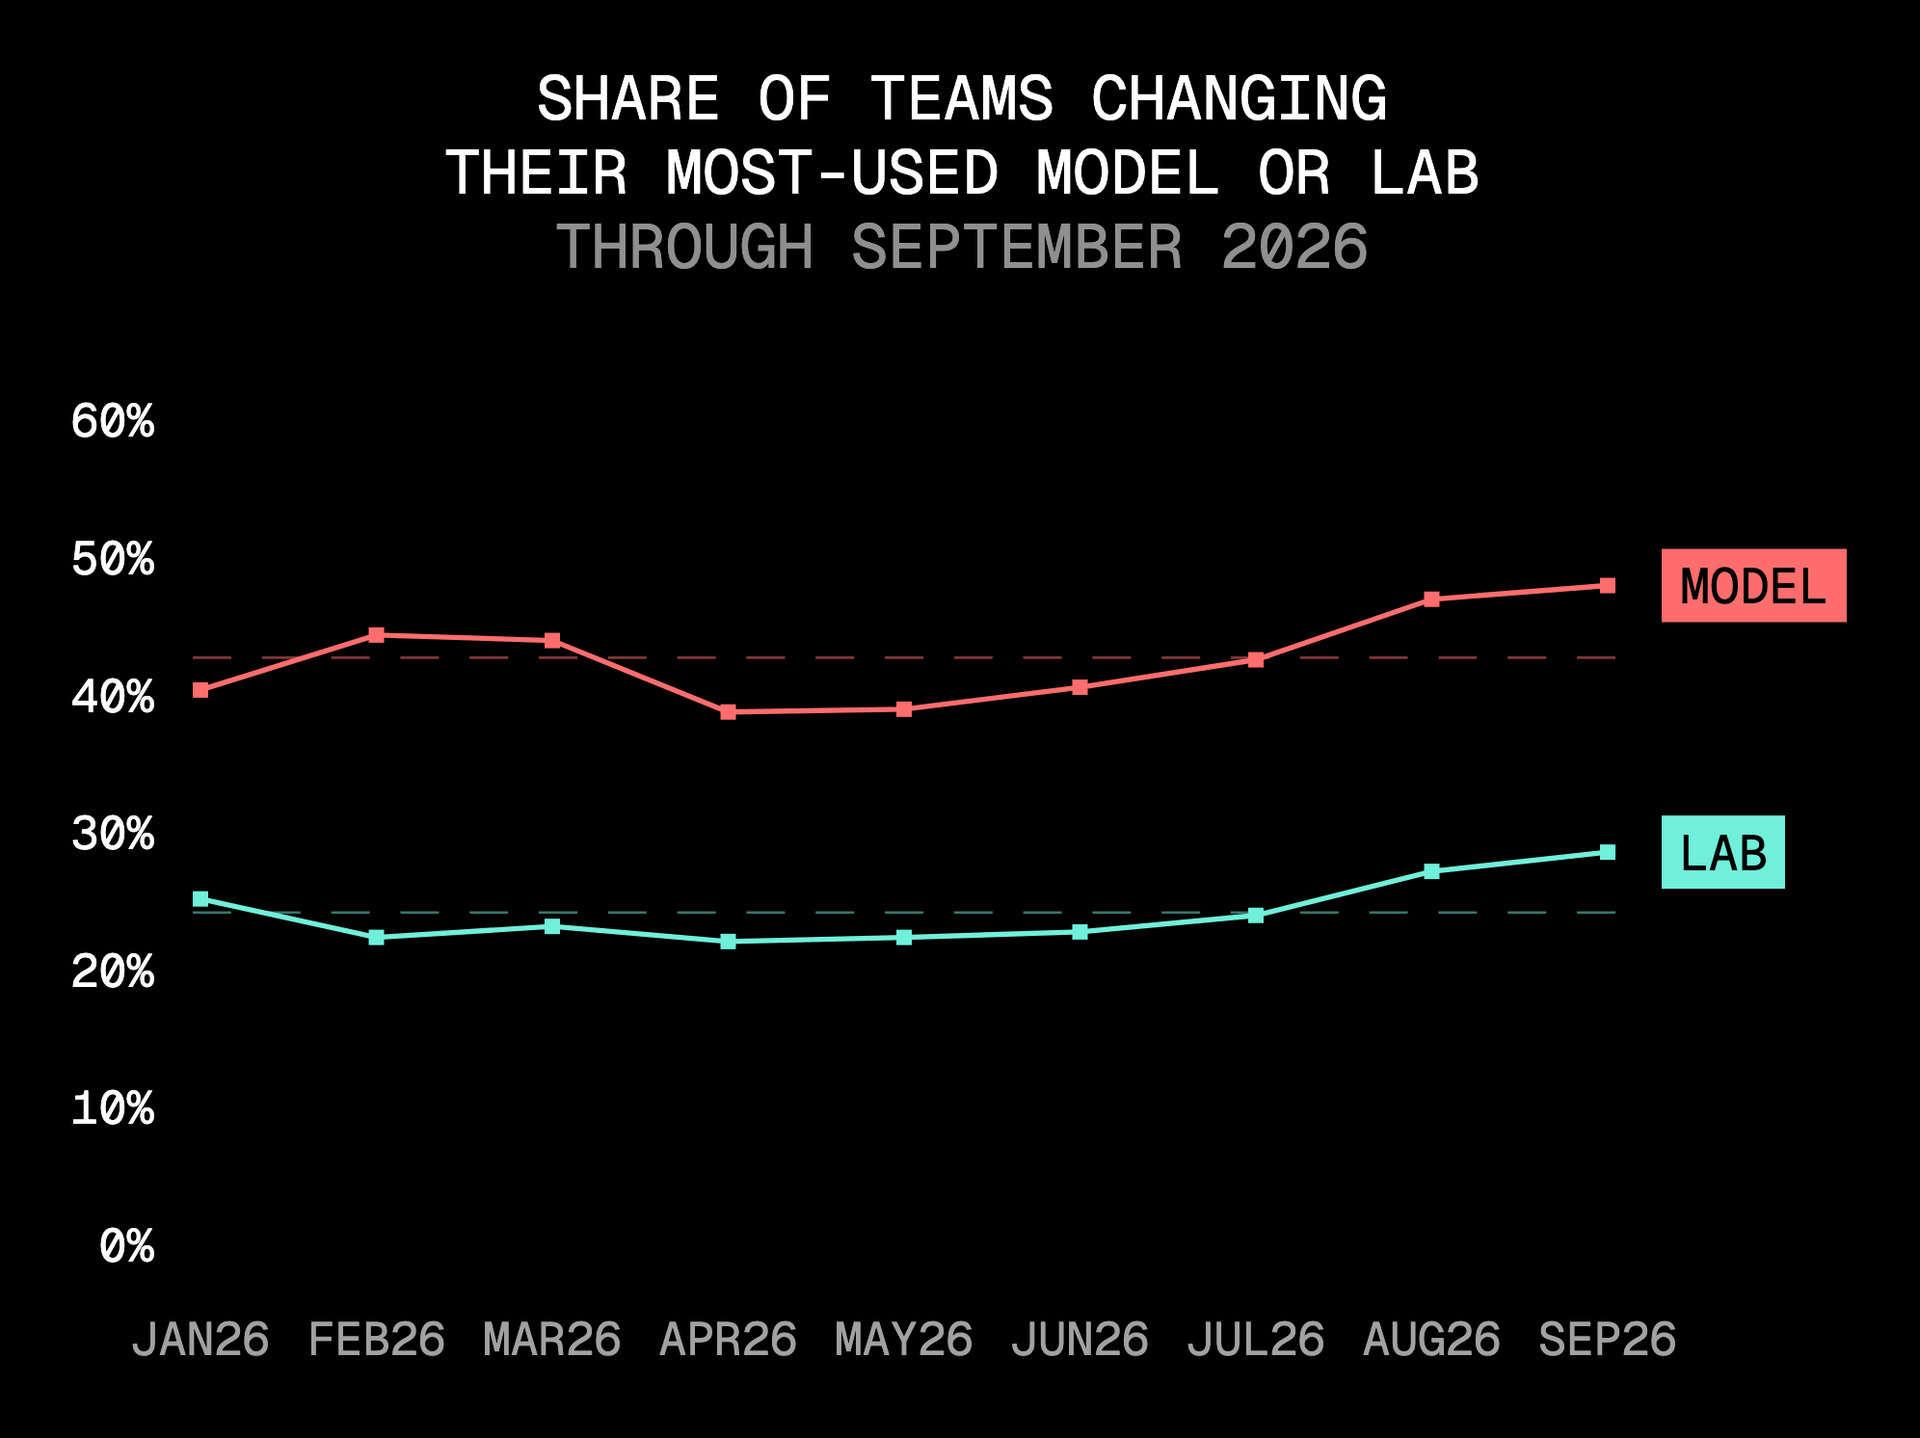
Teams are spending more, but labs have to keep winning their business. In September, nearly one in two teams changed their most-used model. And almost one in three changed their most-used lab, an index record.
Even teams with lower token volumes use a wide mix of models. Since December, teams that processed at least 10 million tokens over that period used an average of 15 different models. The average rose to 26 for teams processing at least 100 million tokens, and 42 for those processing at least a billion.
The model is becoming a replaceable part of a much larger investment. Companies can continuously improve their AI products and workflows while changing which models power them. They can spend more on AI without becoming more dependent on any one lab.
Copy link to headingChinese models are big business for American providers
More than two-thirds of September’s gateway spend on Chinese-origin models went to US-based providers, up from less than a tenth in December. The Chinese lab builds the model; the American provider runs it and sells access.
DeepSeek’s models processed 58% of all gateway tokens for 6.6% of spend. More than four in five of those tokens were served by DeepSeek itself, yet two in five dollars spent on its models went through US-based providers.
Moonshot AI, the Beijing-based lab behind Kimi, accounted for 3.6% of gateway tokens and 13.2% of spend in September. US-based providers served nine in ten of those tokens.
Z.ai, also based in Beijing and the creator of GLM, accounted for 7.2% of all tokens and 4.5% of spend. US-based providers served seven in ten.
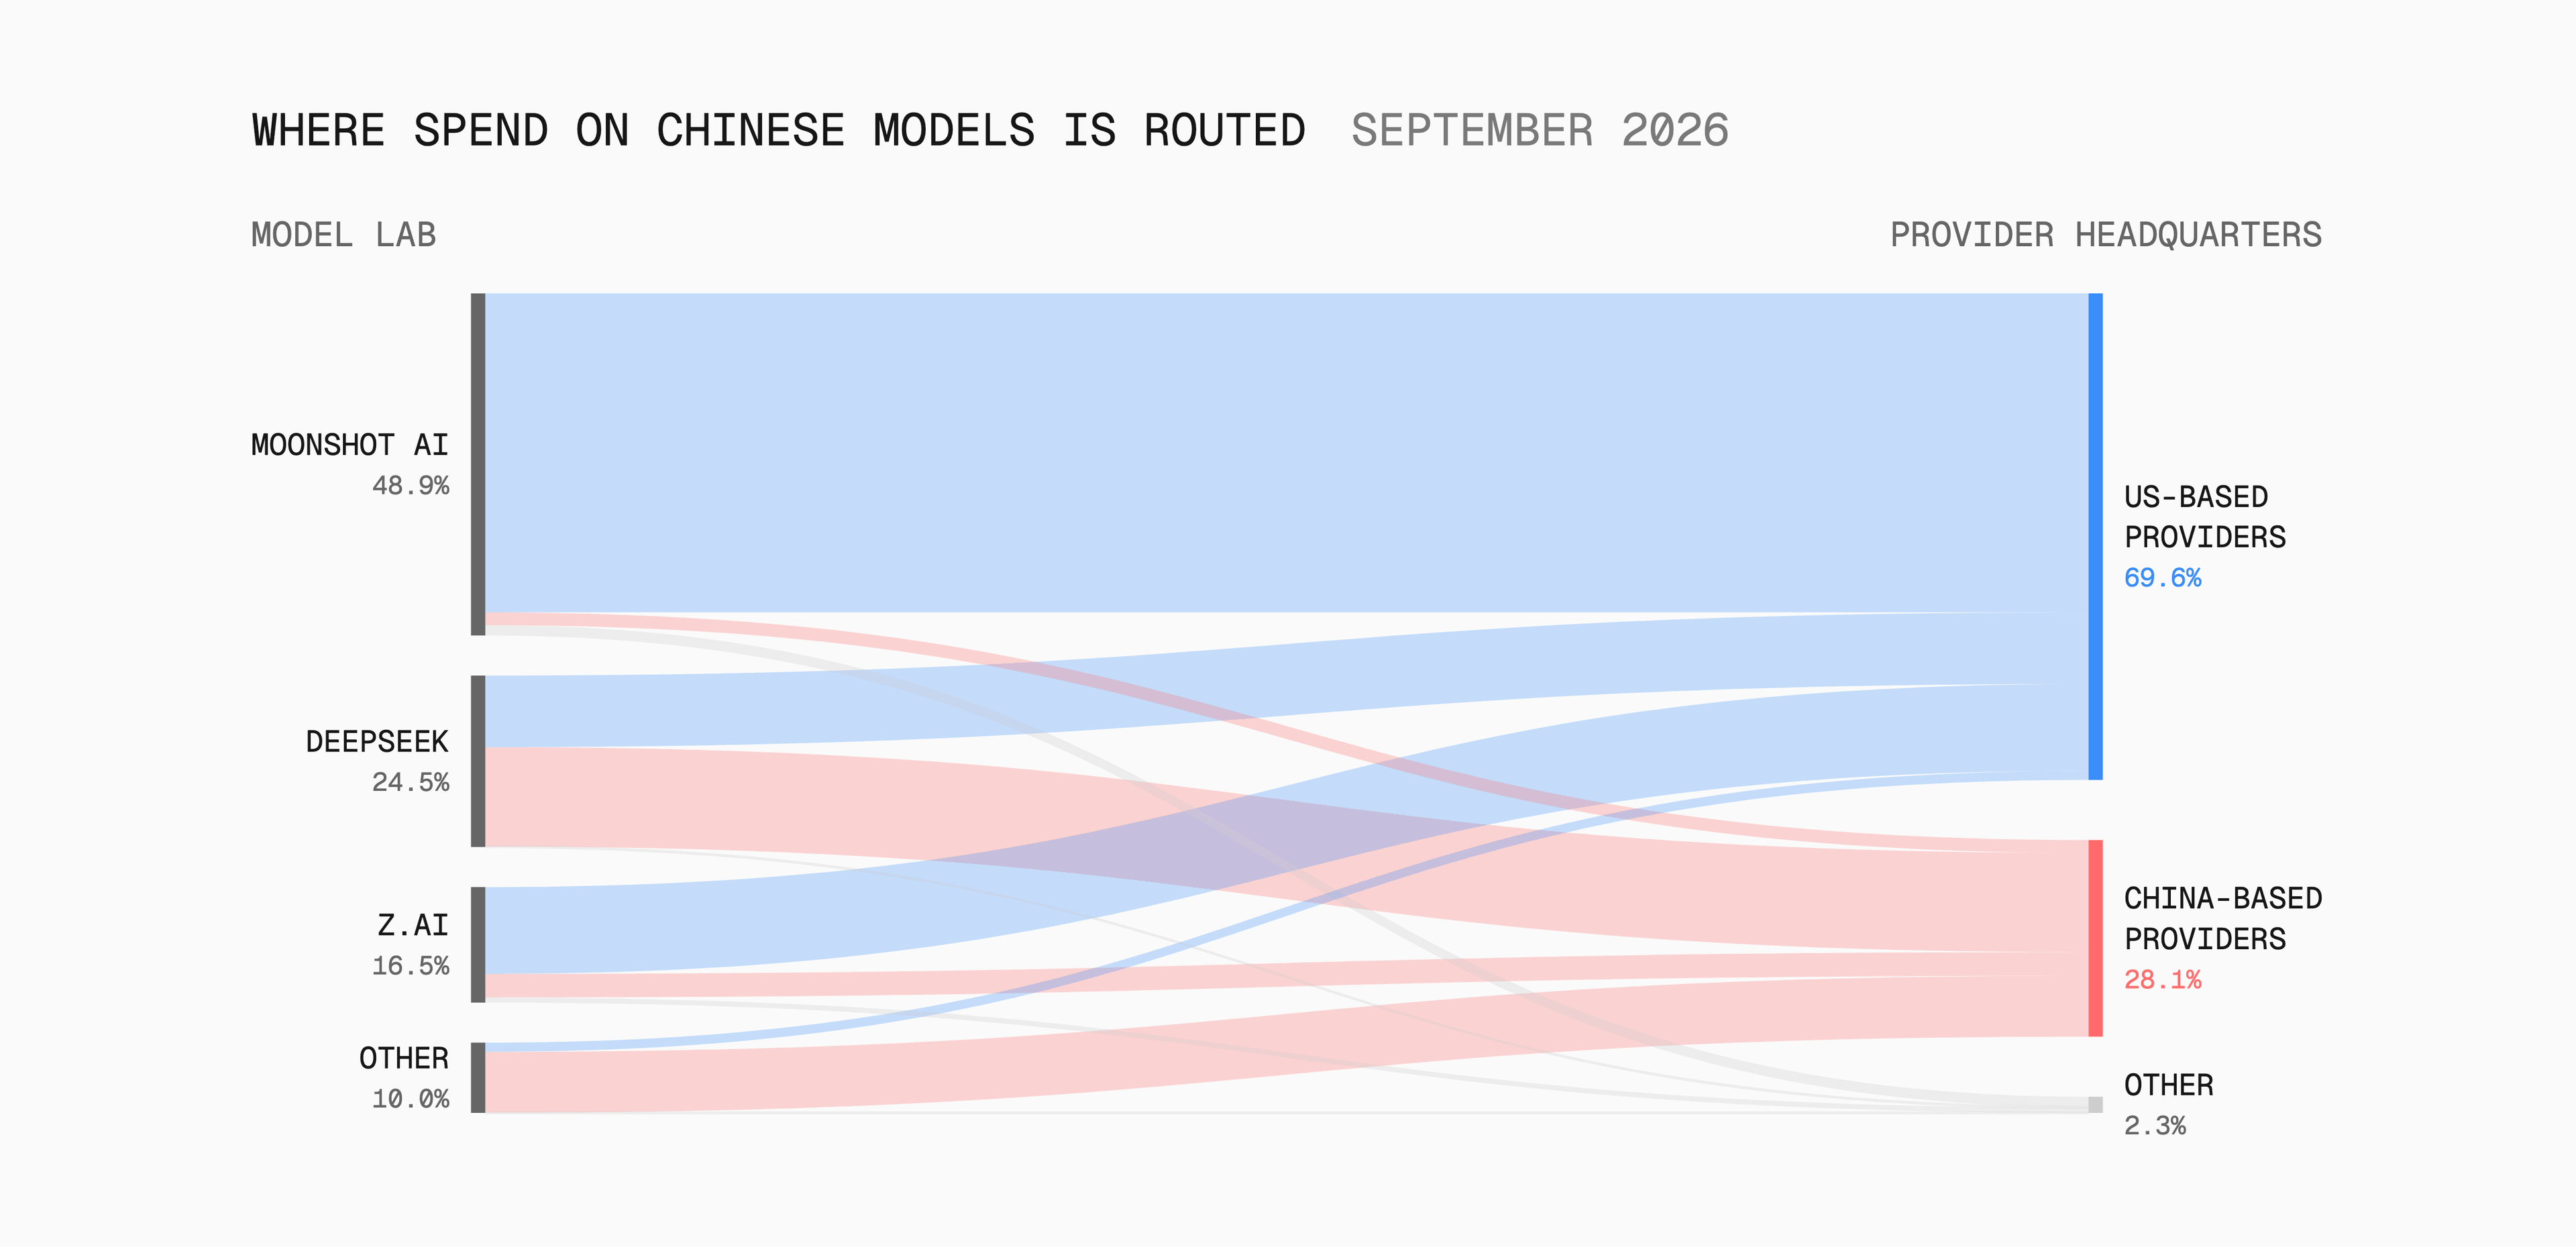
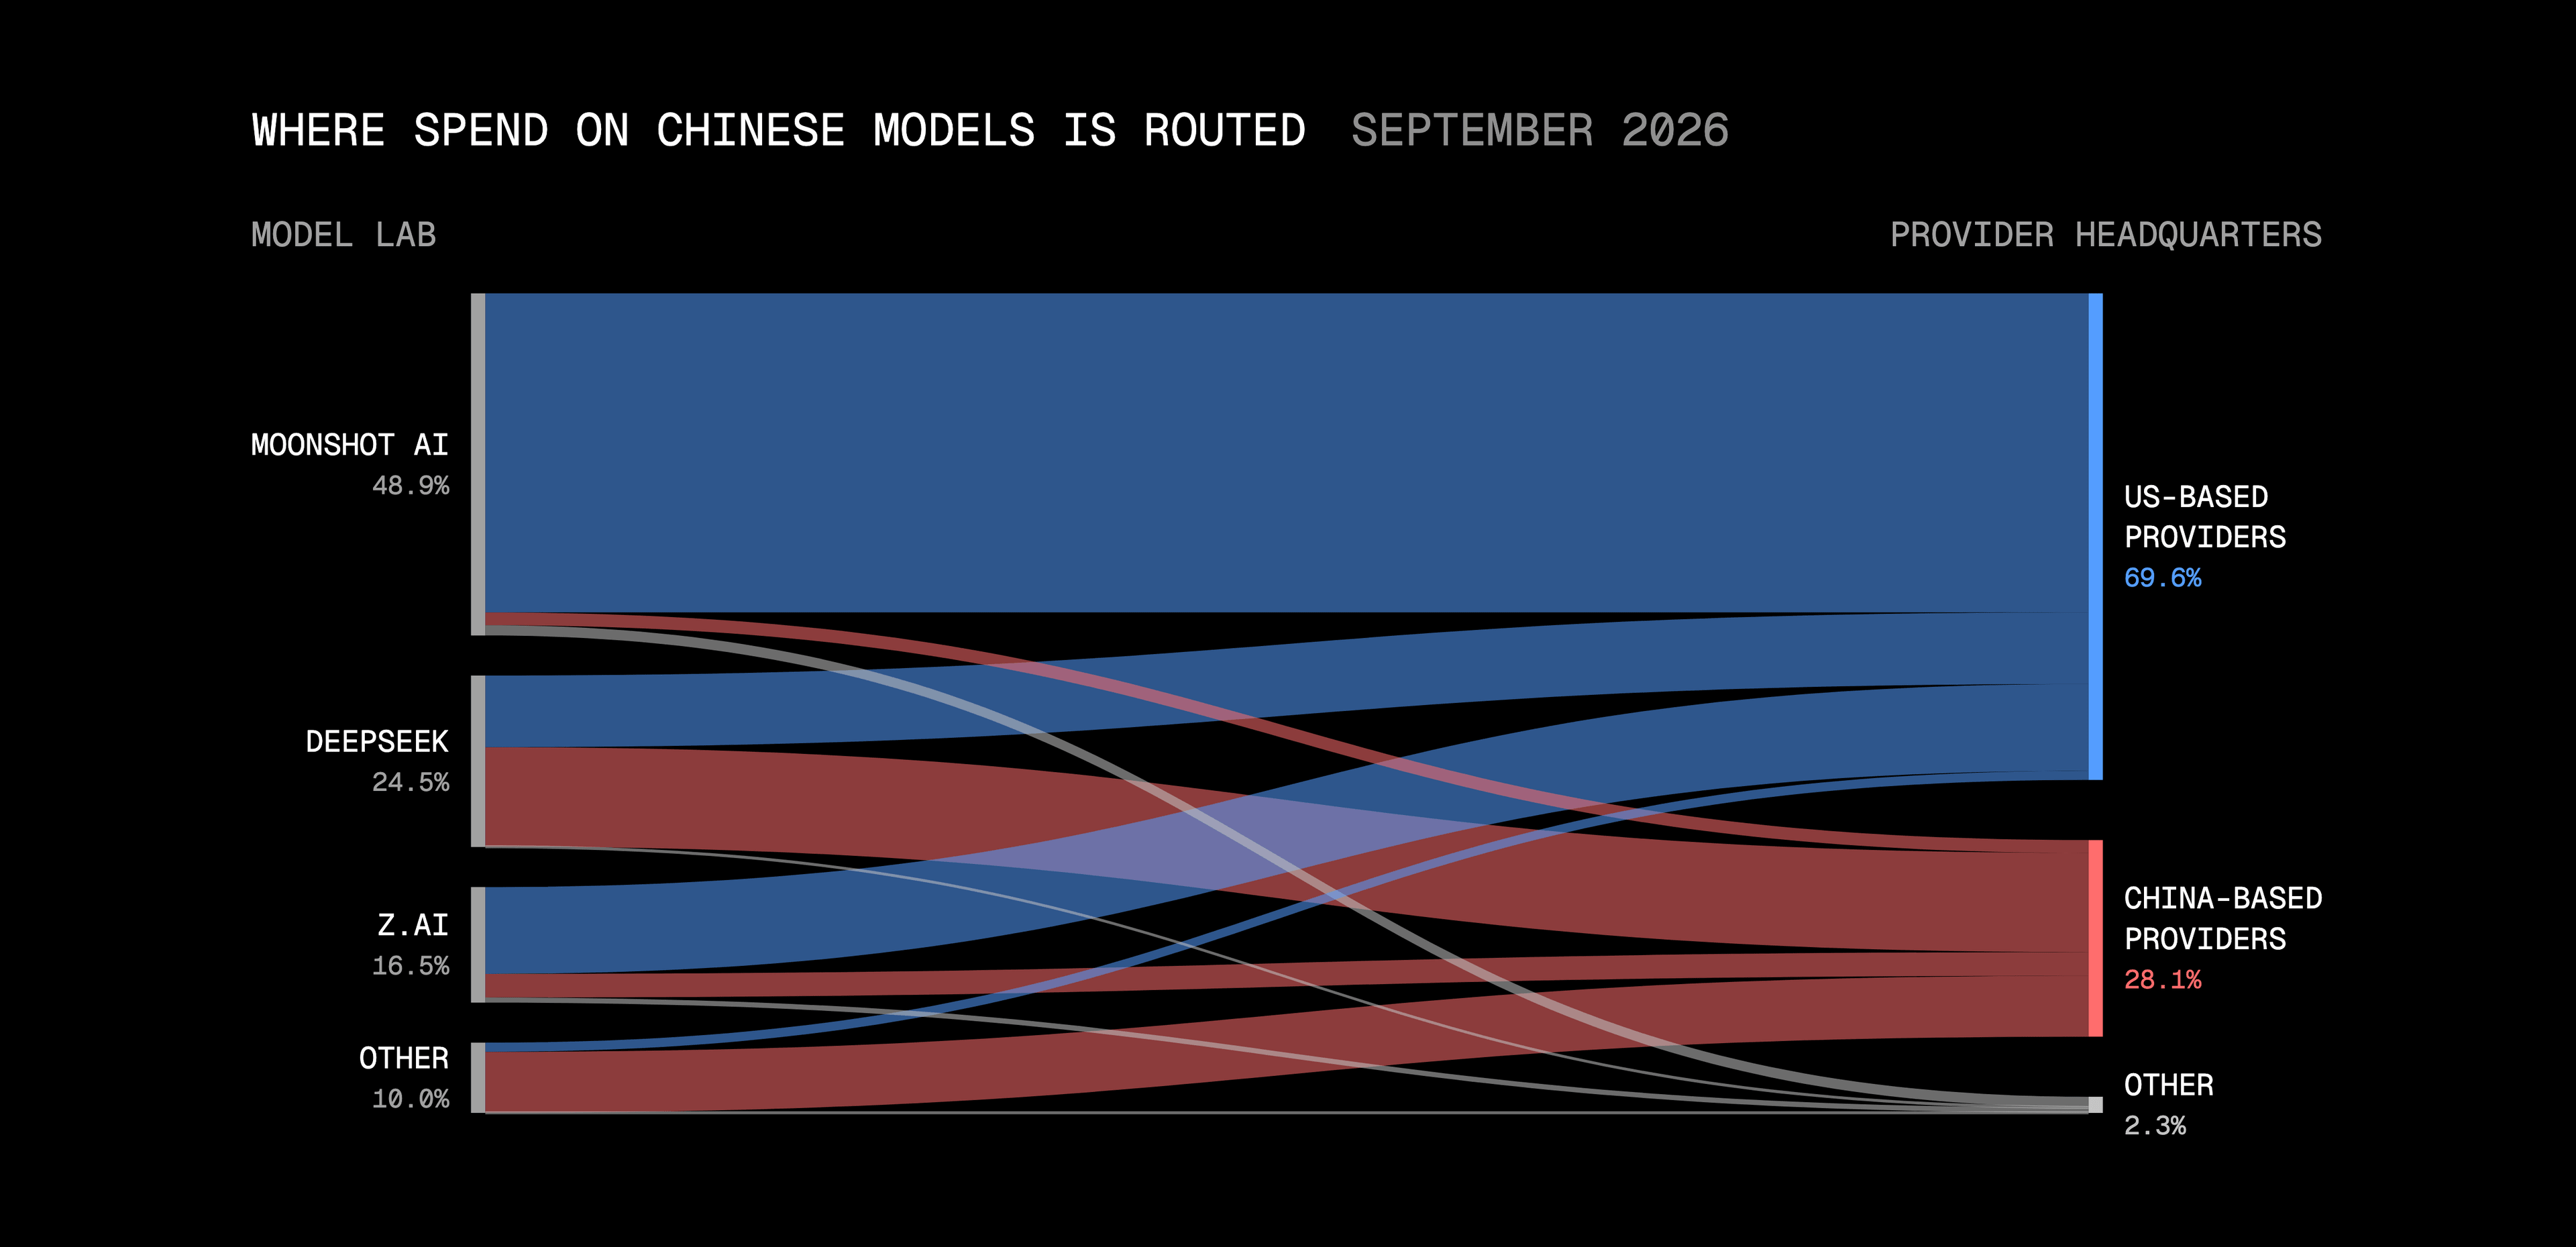
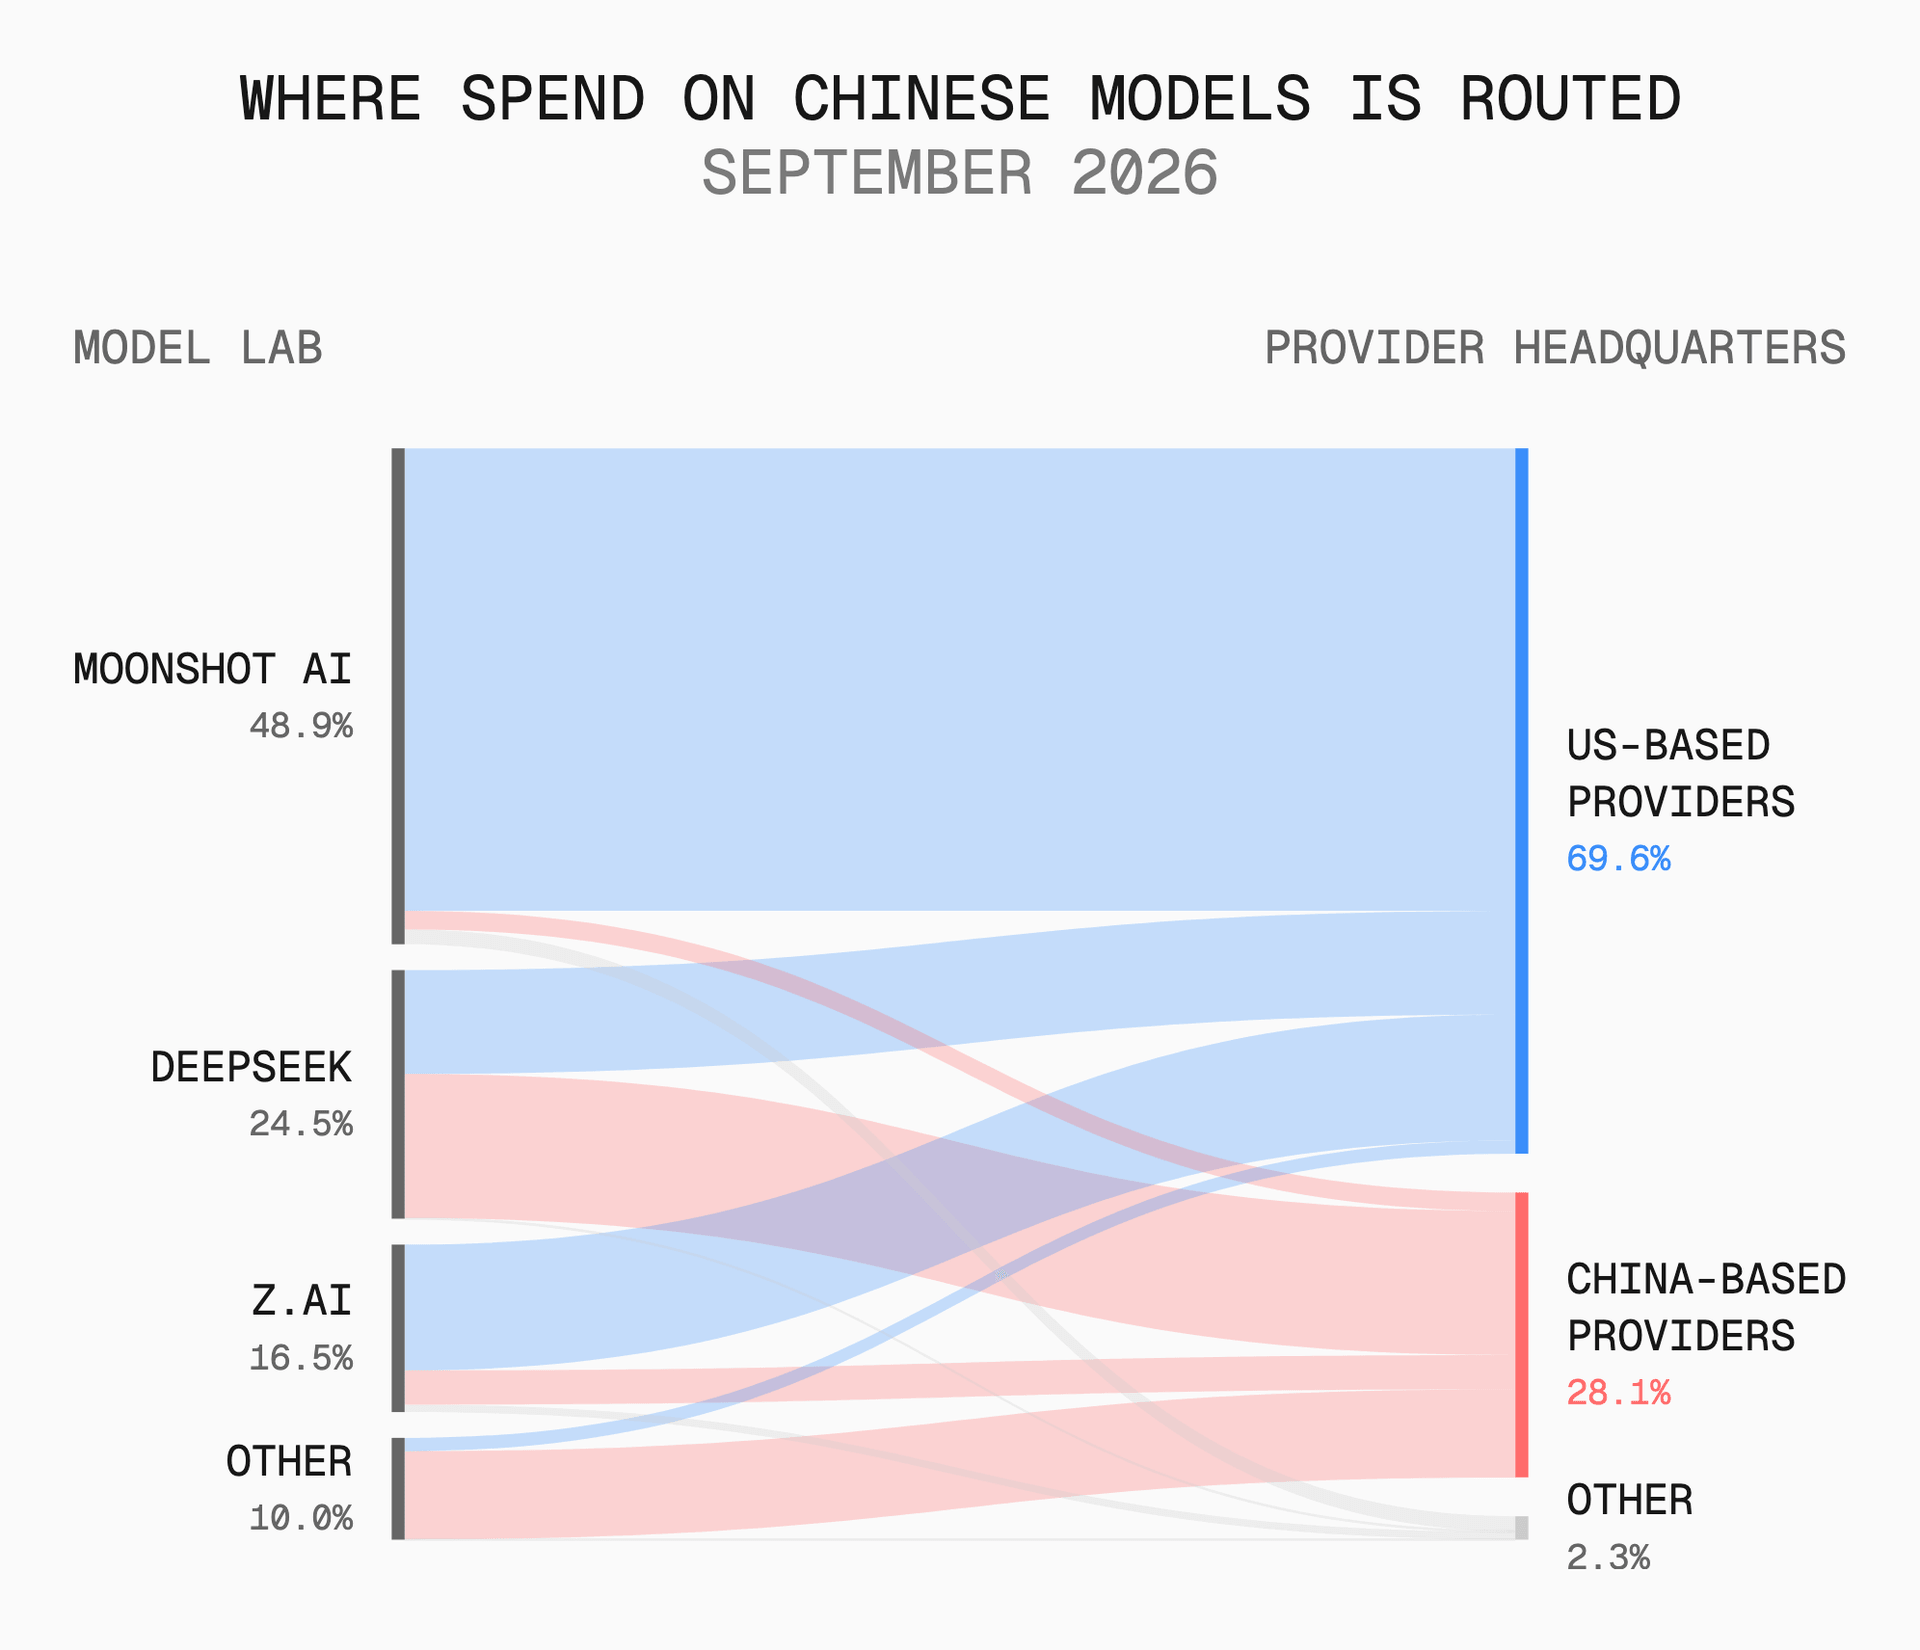
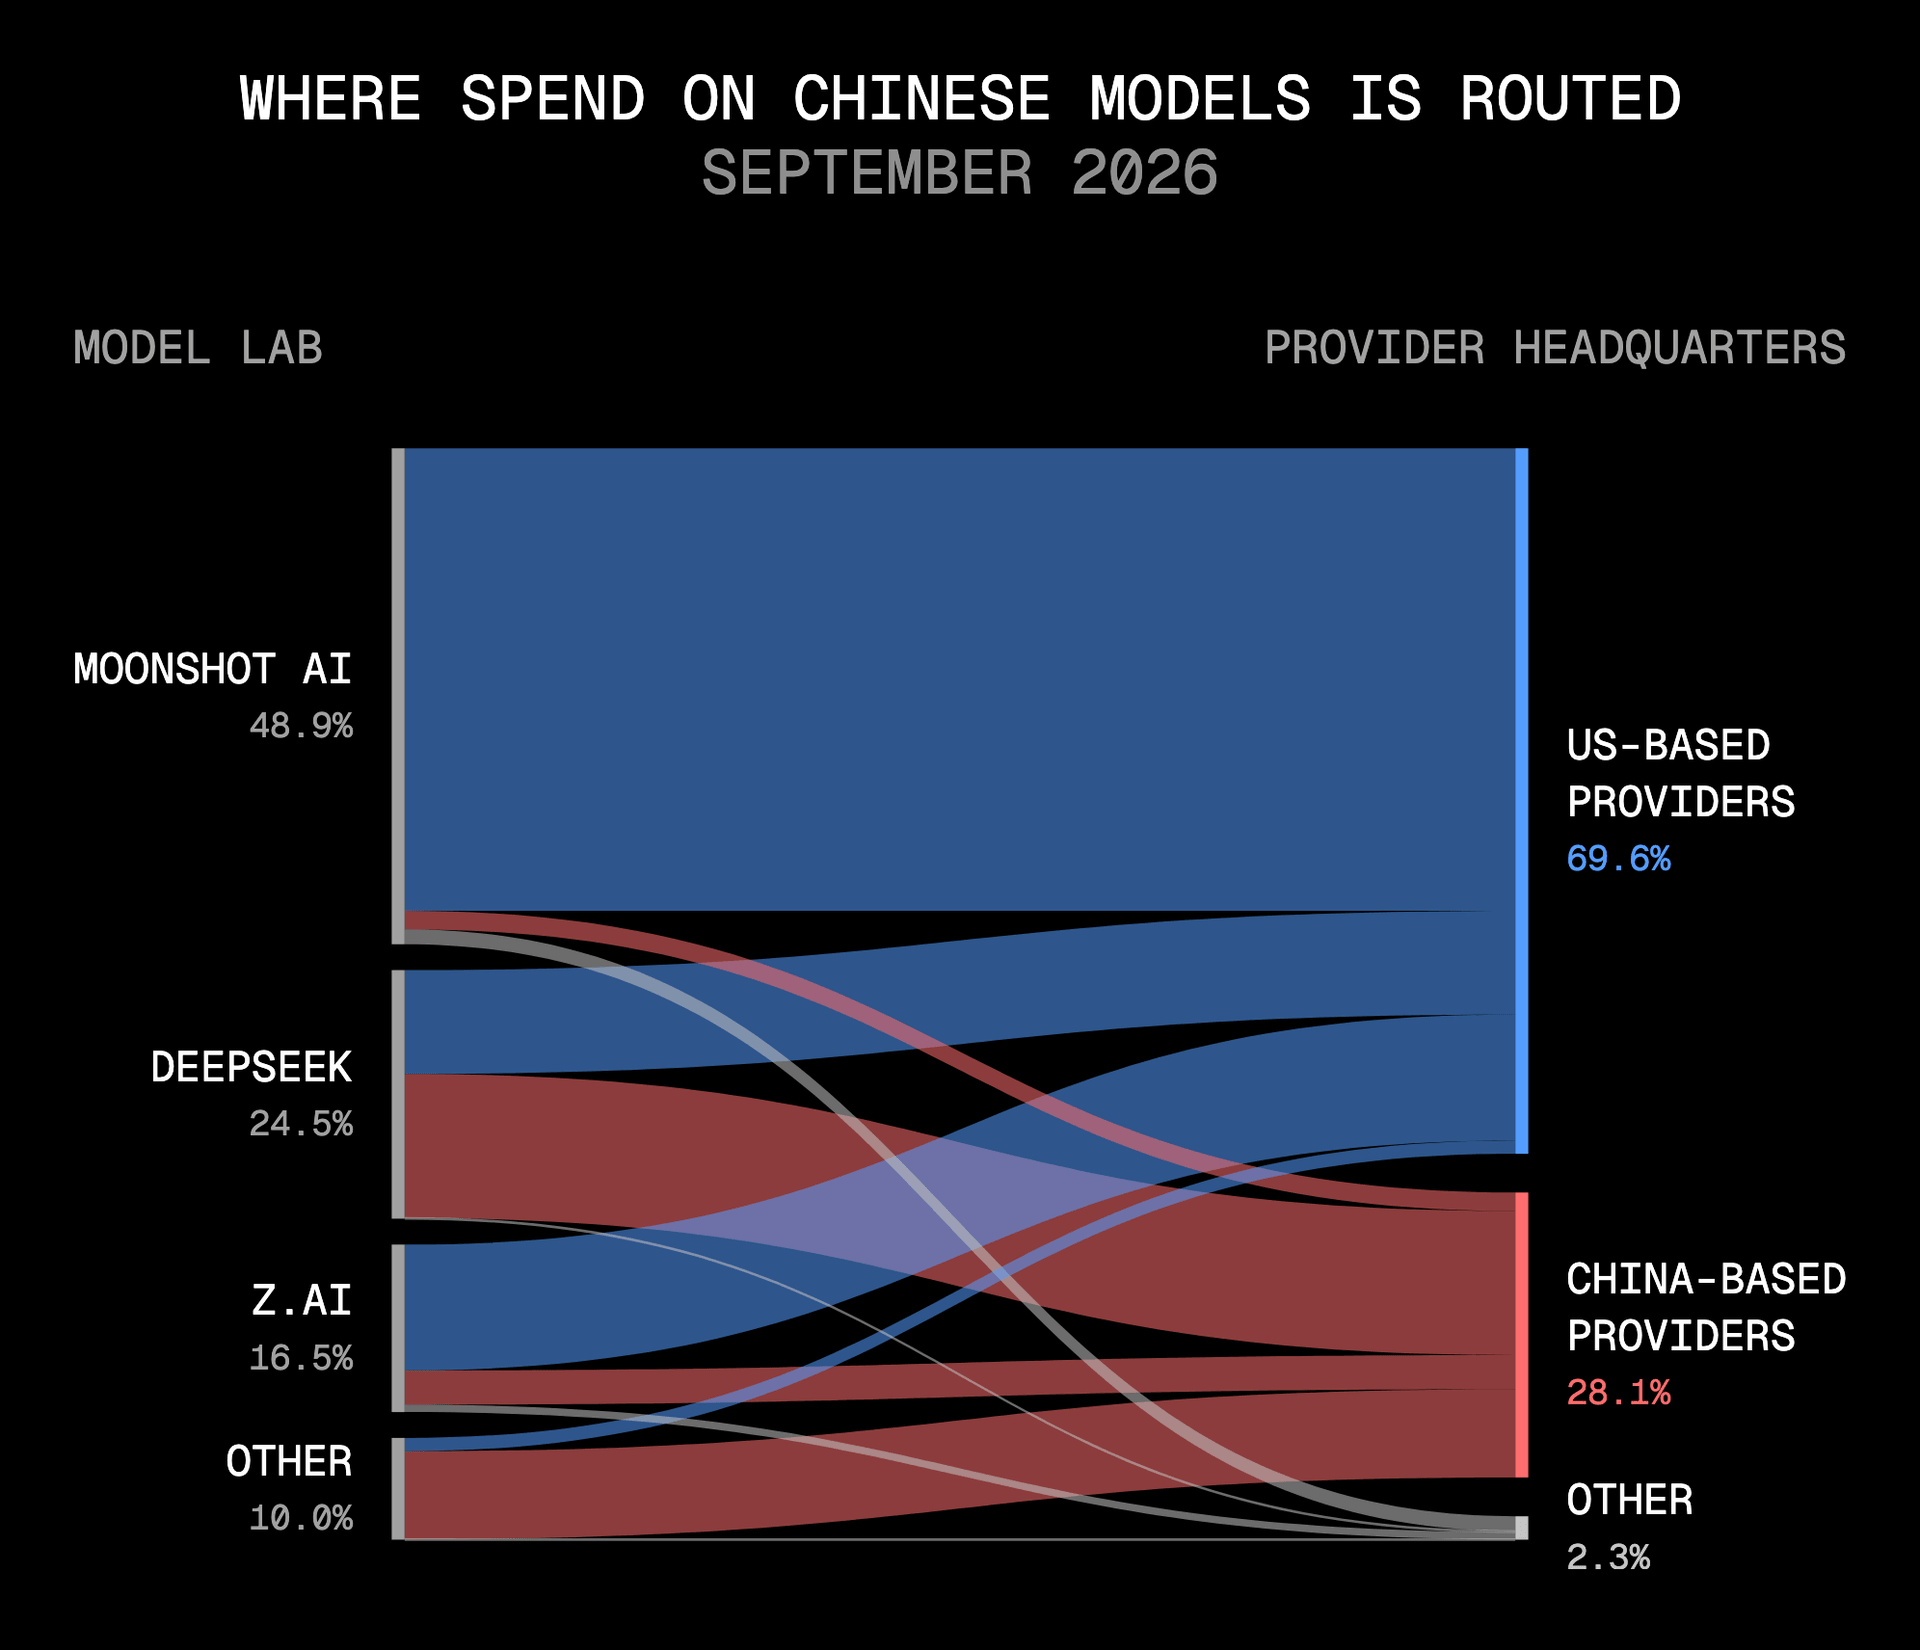
Customers can use Chinese models through access sold by American providers. For teams that put more money into Chinese models in September, an average of 53% of their spending on those models went through US-based providers and 41% through China-based ones.
The same Chinese model can compete with US-based models while generating revenue for US-based providers.
Copy link to headingSeptember model launch scorecard: Jev, Opus 5.5, and GPT-6
Whether a model launch is successful depends on what you measure: how broadly it’s tried, how much usage and spend it receives, or what share of its initial users return. We ranked every model launch in September with at least two weeks of data by these metrics; the tables show the top ten for each. The full scorecard is at the end of the report.
Copy link to headingJev is the most-adopted and most-called model
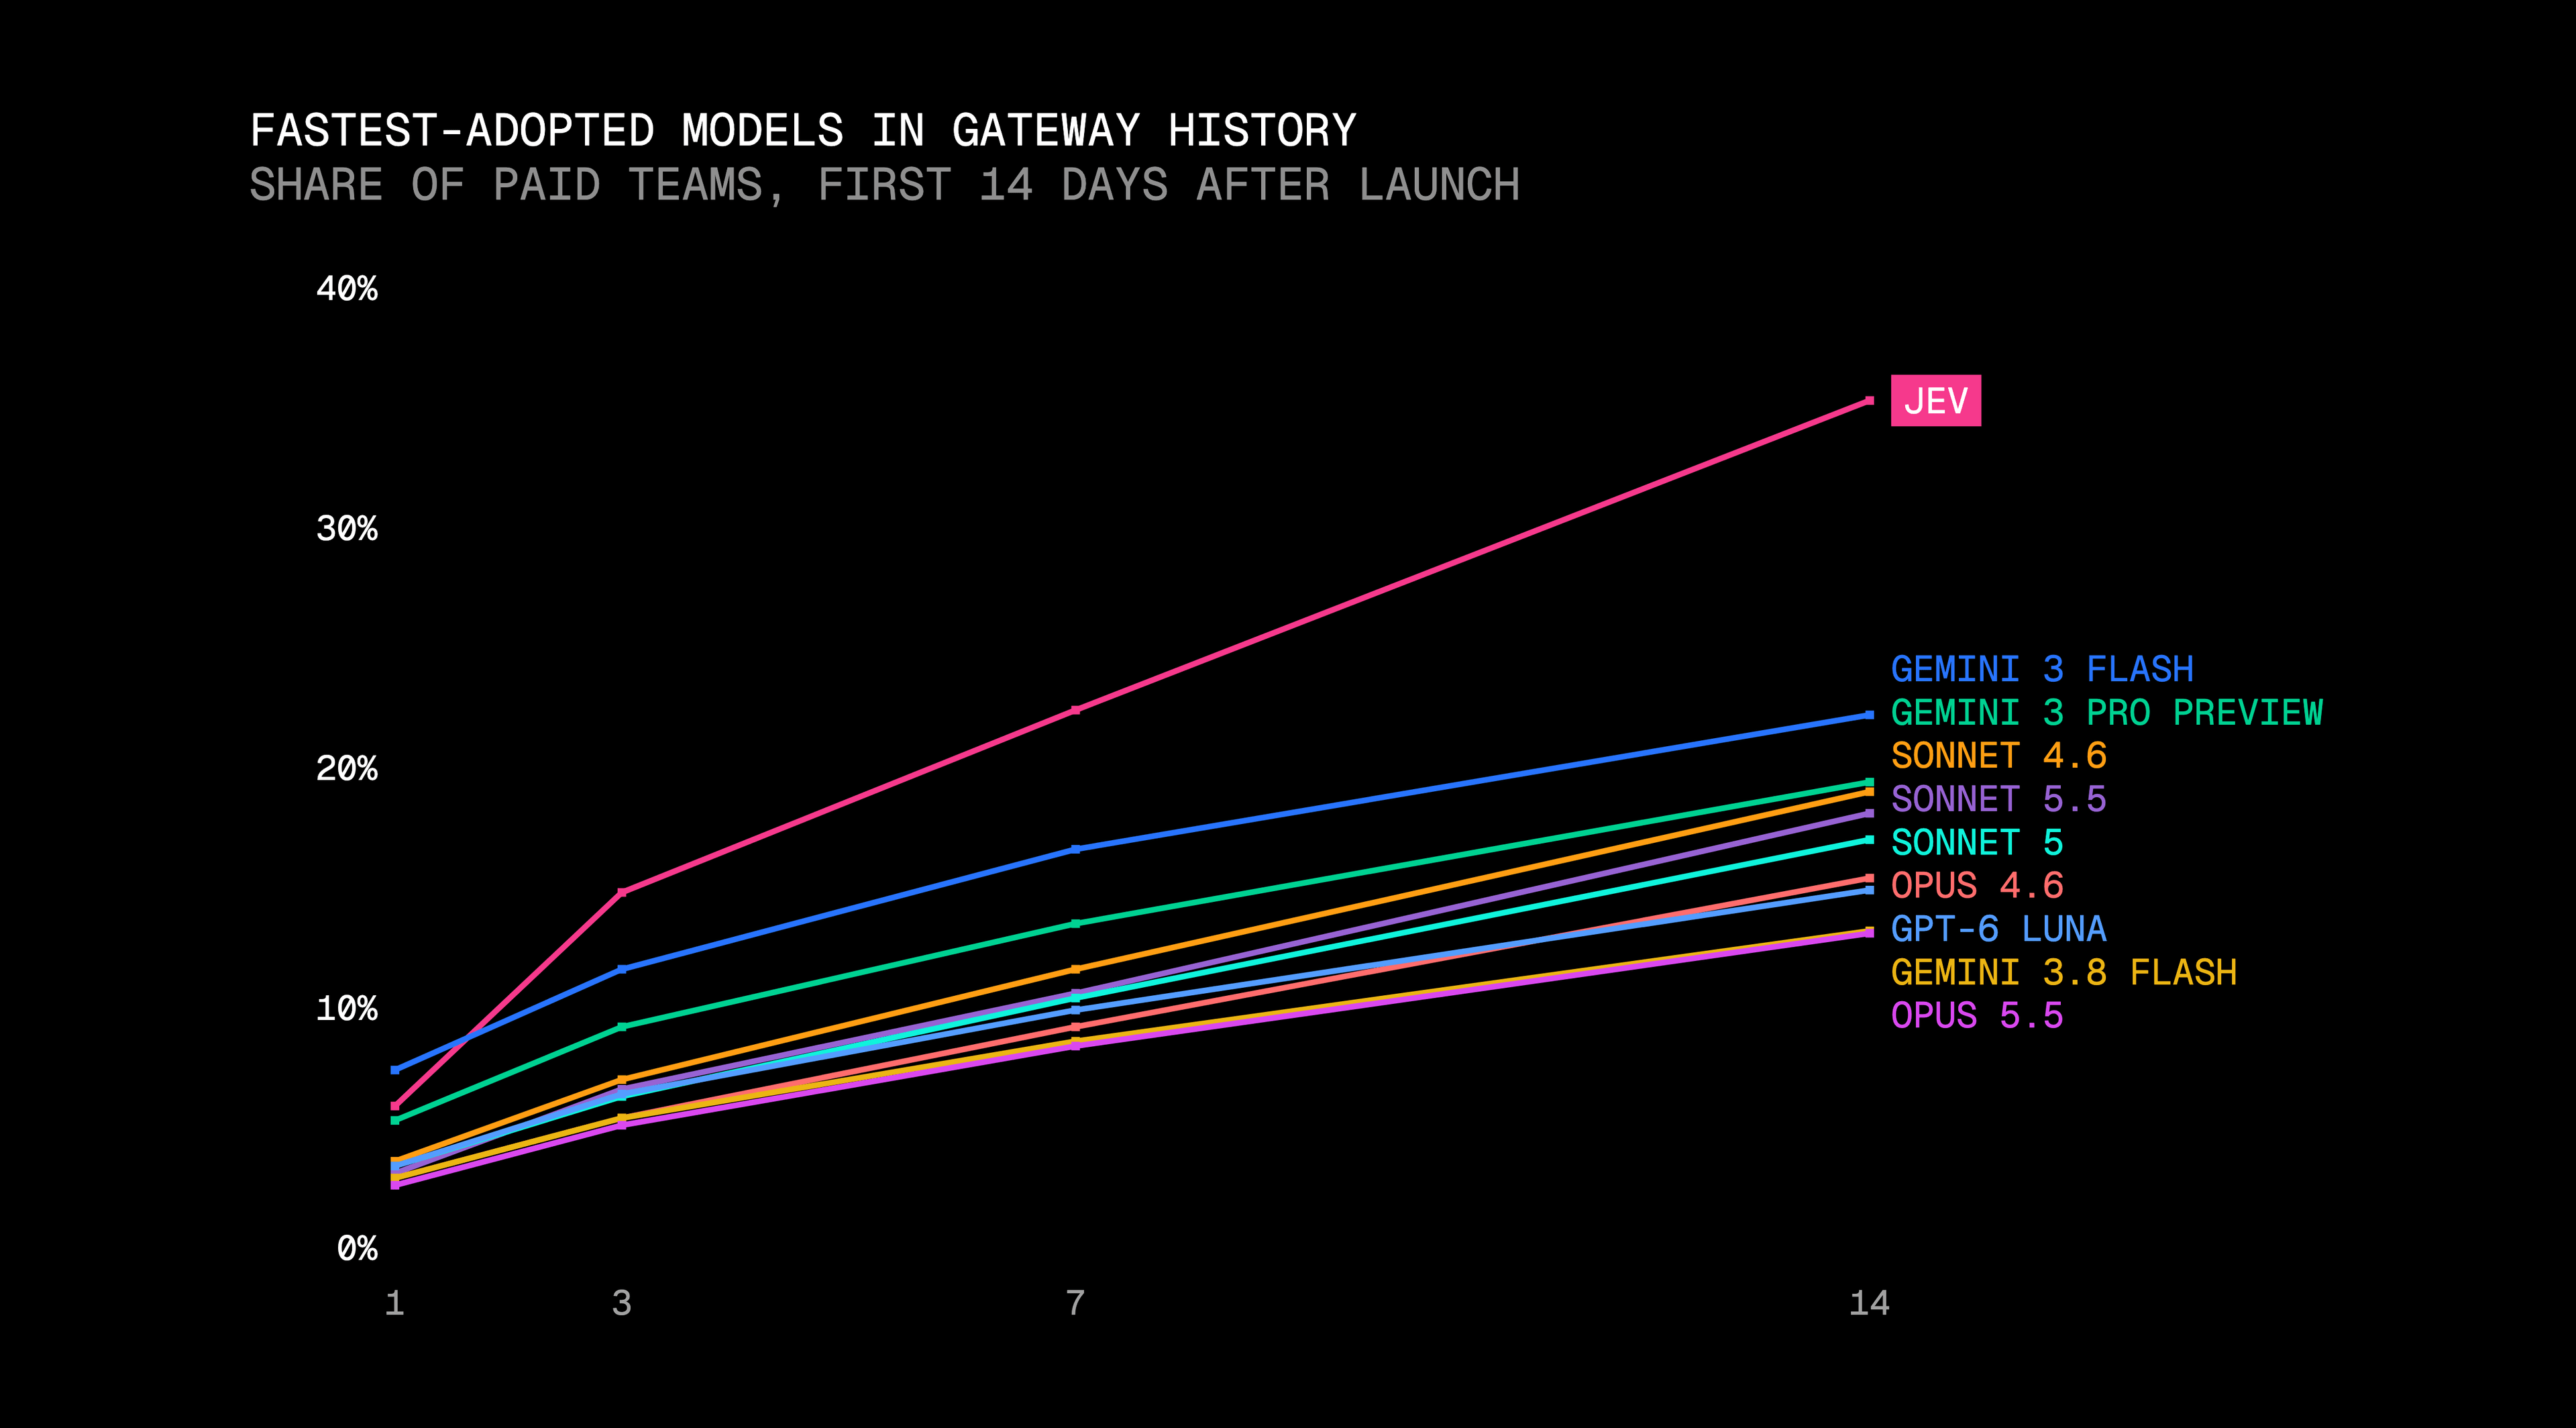
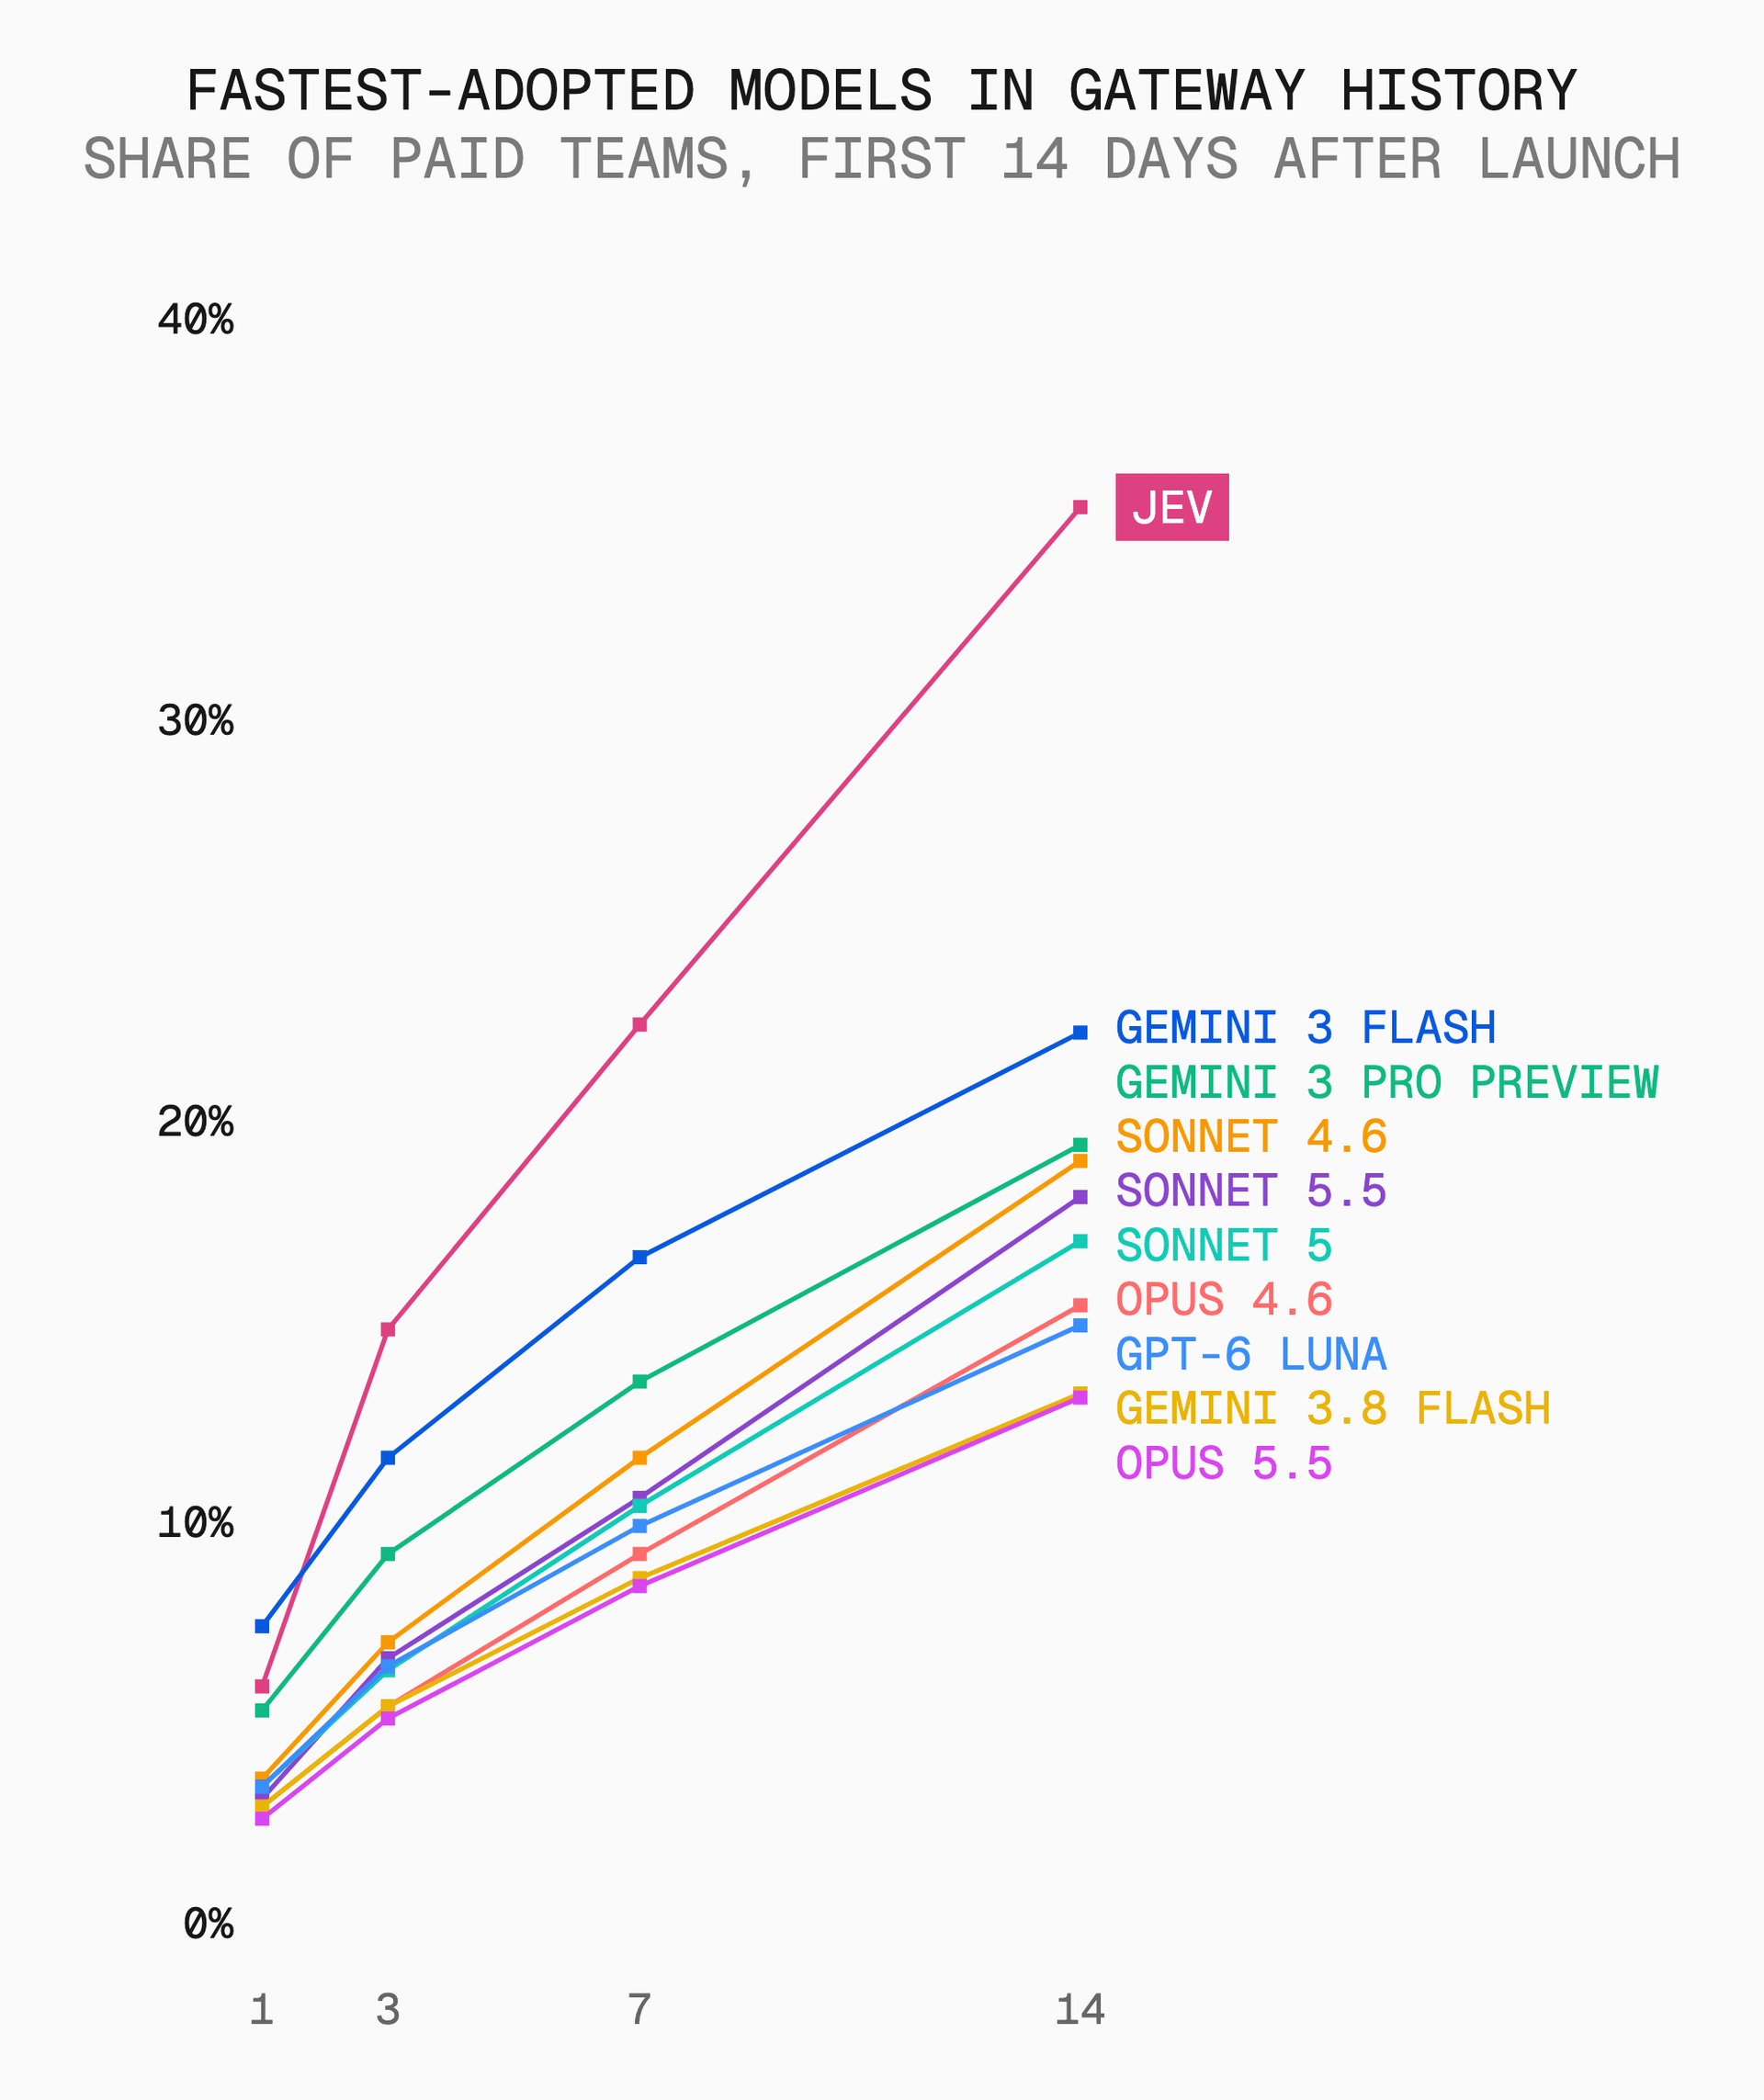
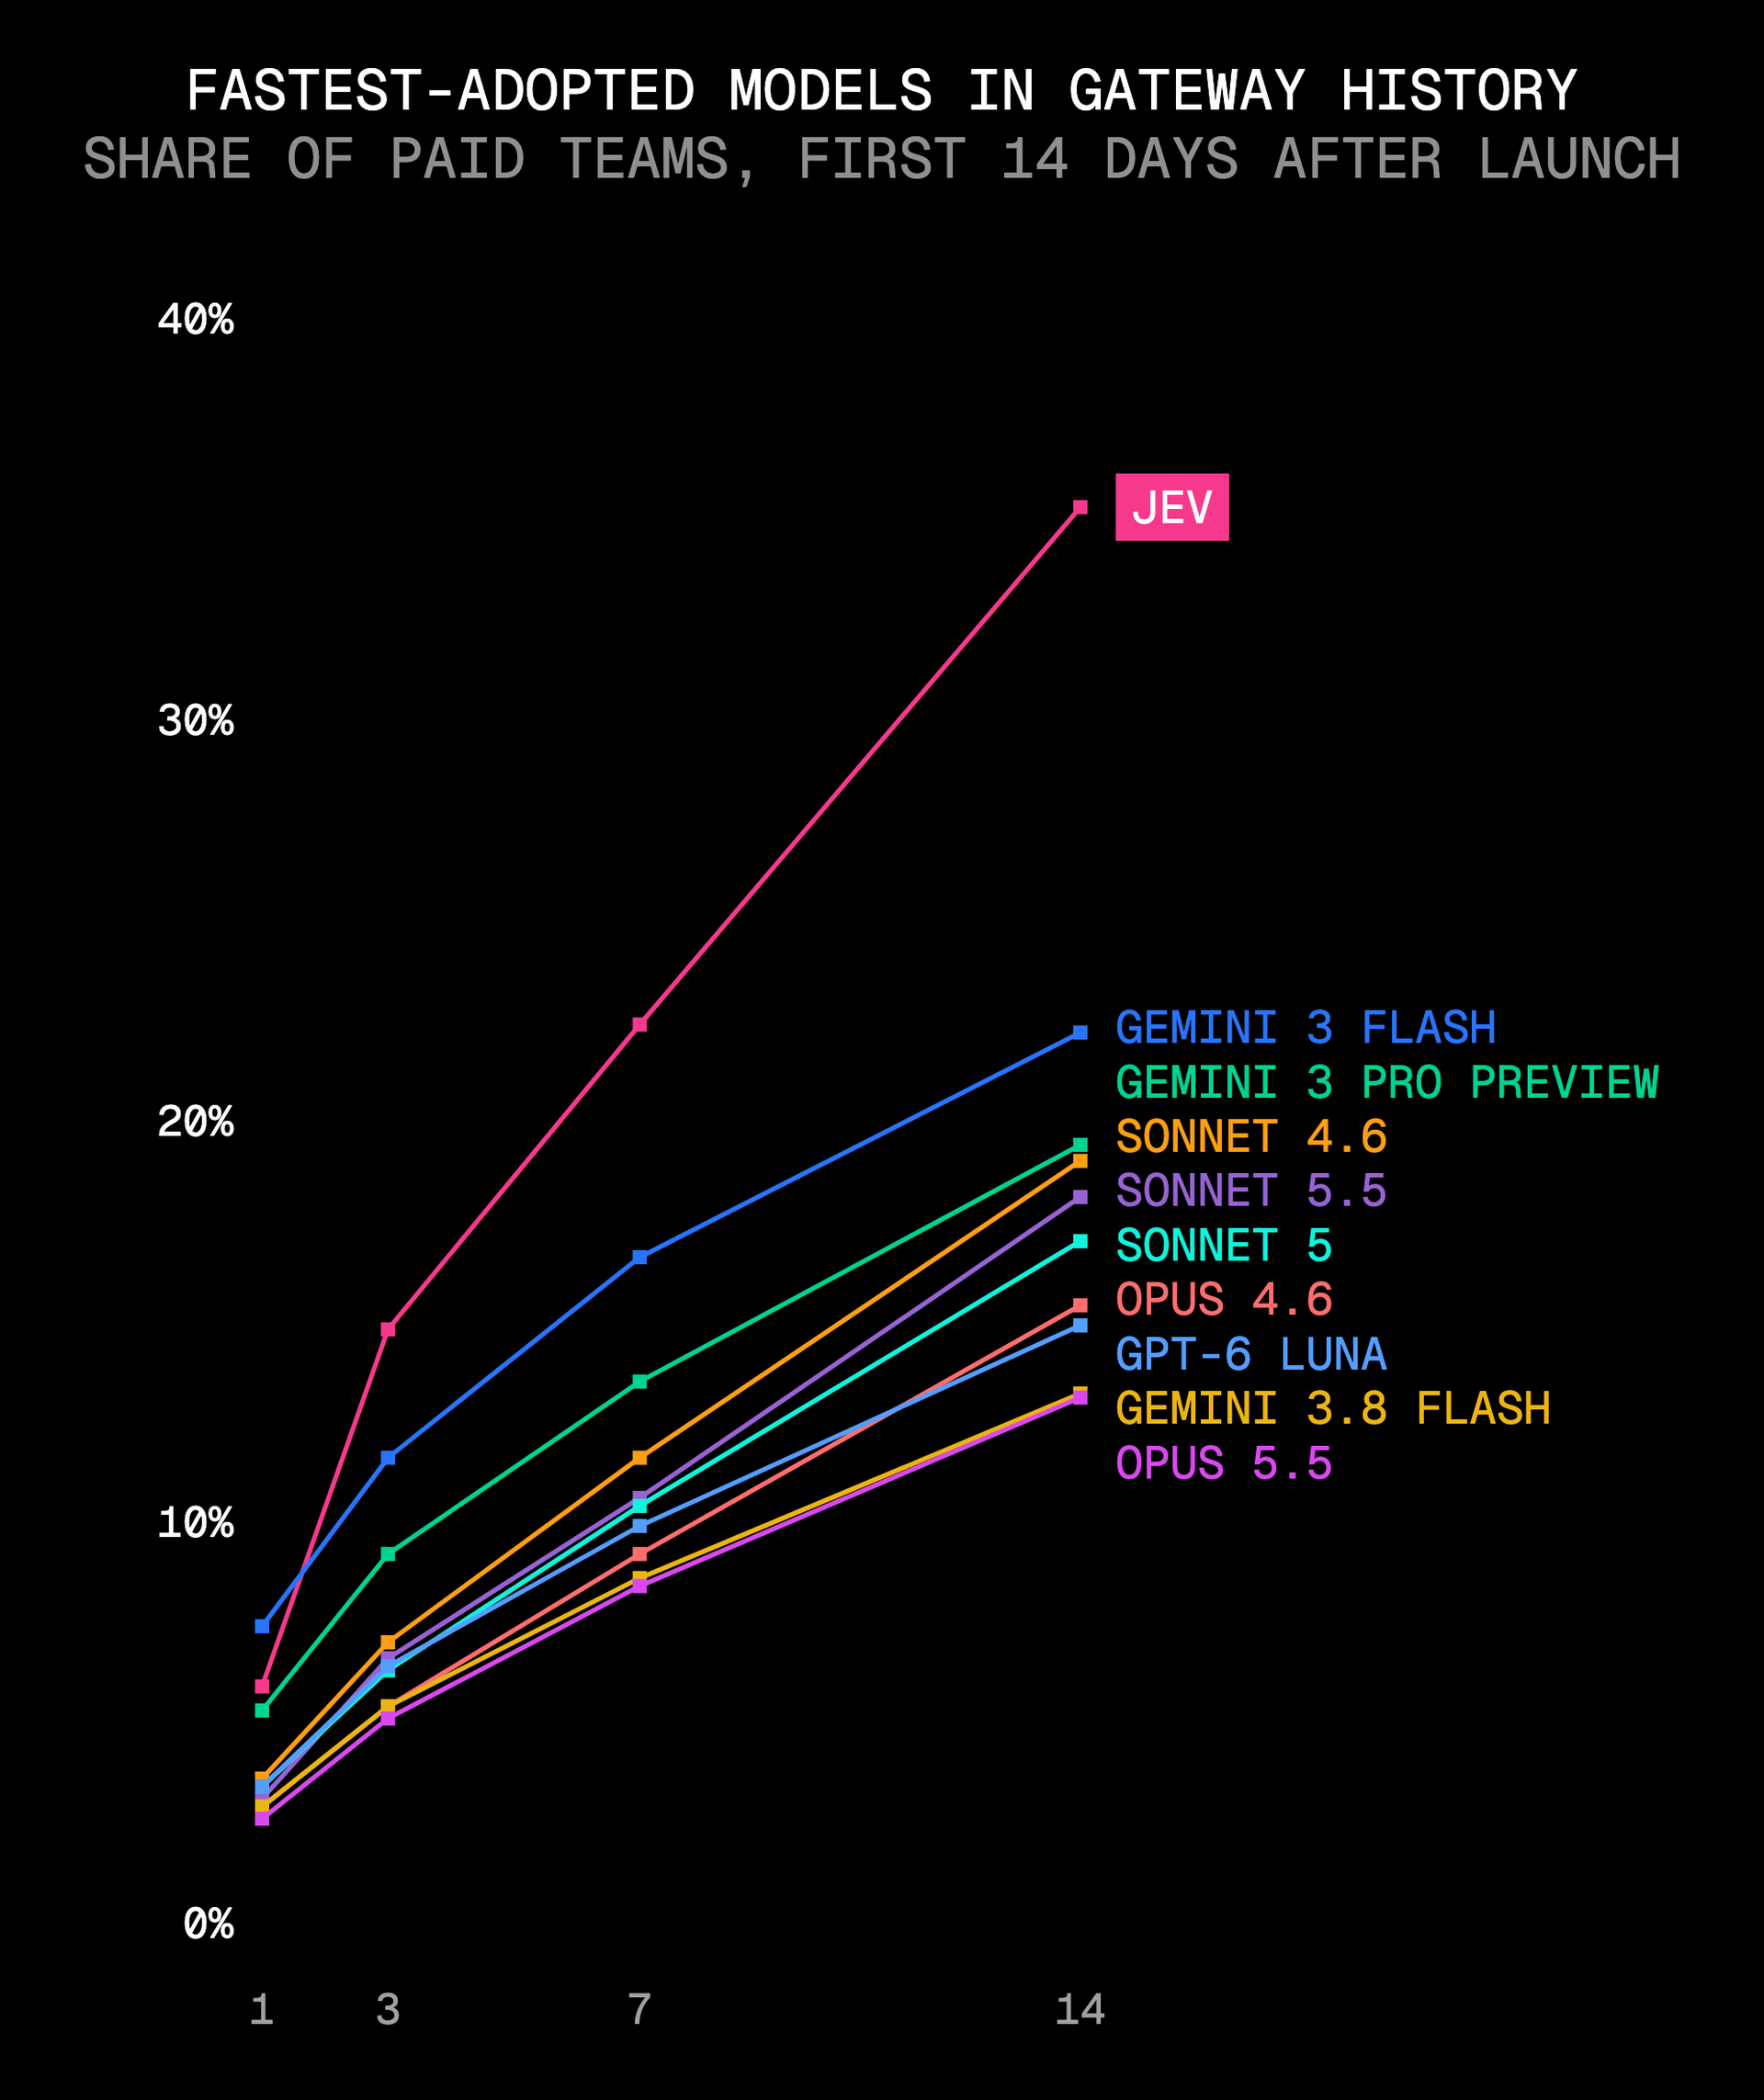
In its first two weeks, Jev reached more than a third of paid teams, nearly double the reach of Sonnet 5.5 in second place. This is the fastest adoption of any model in AI Gateway history.
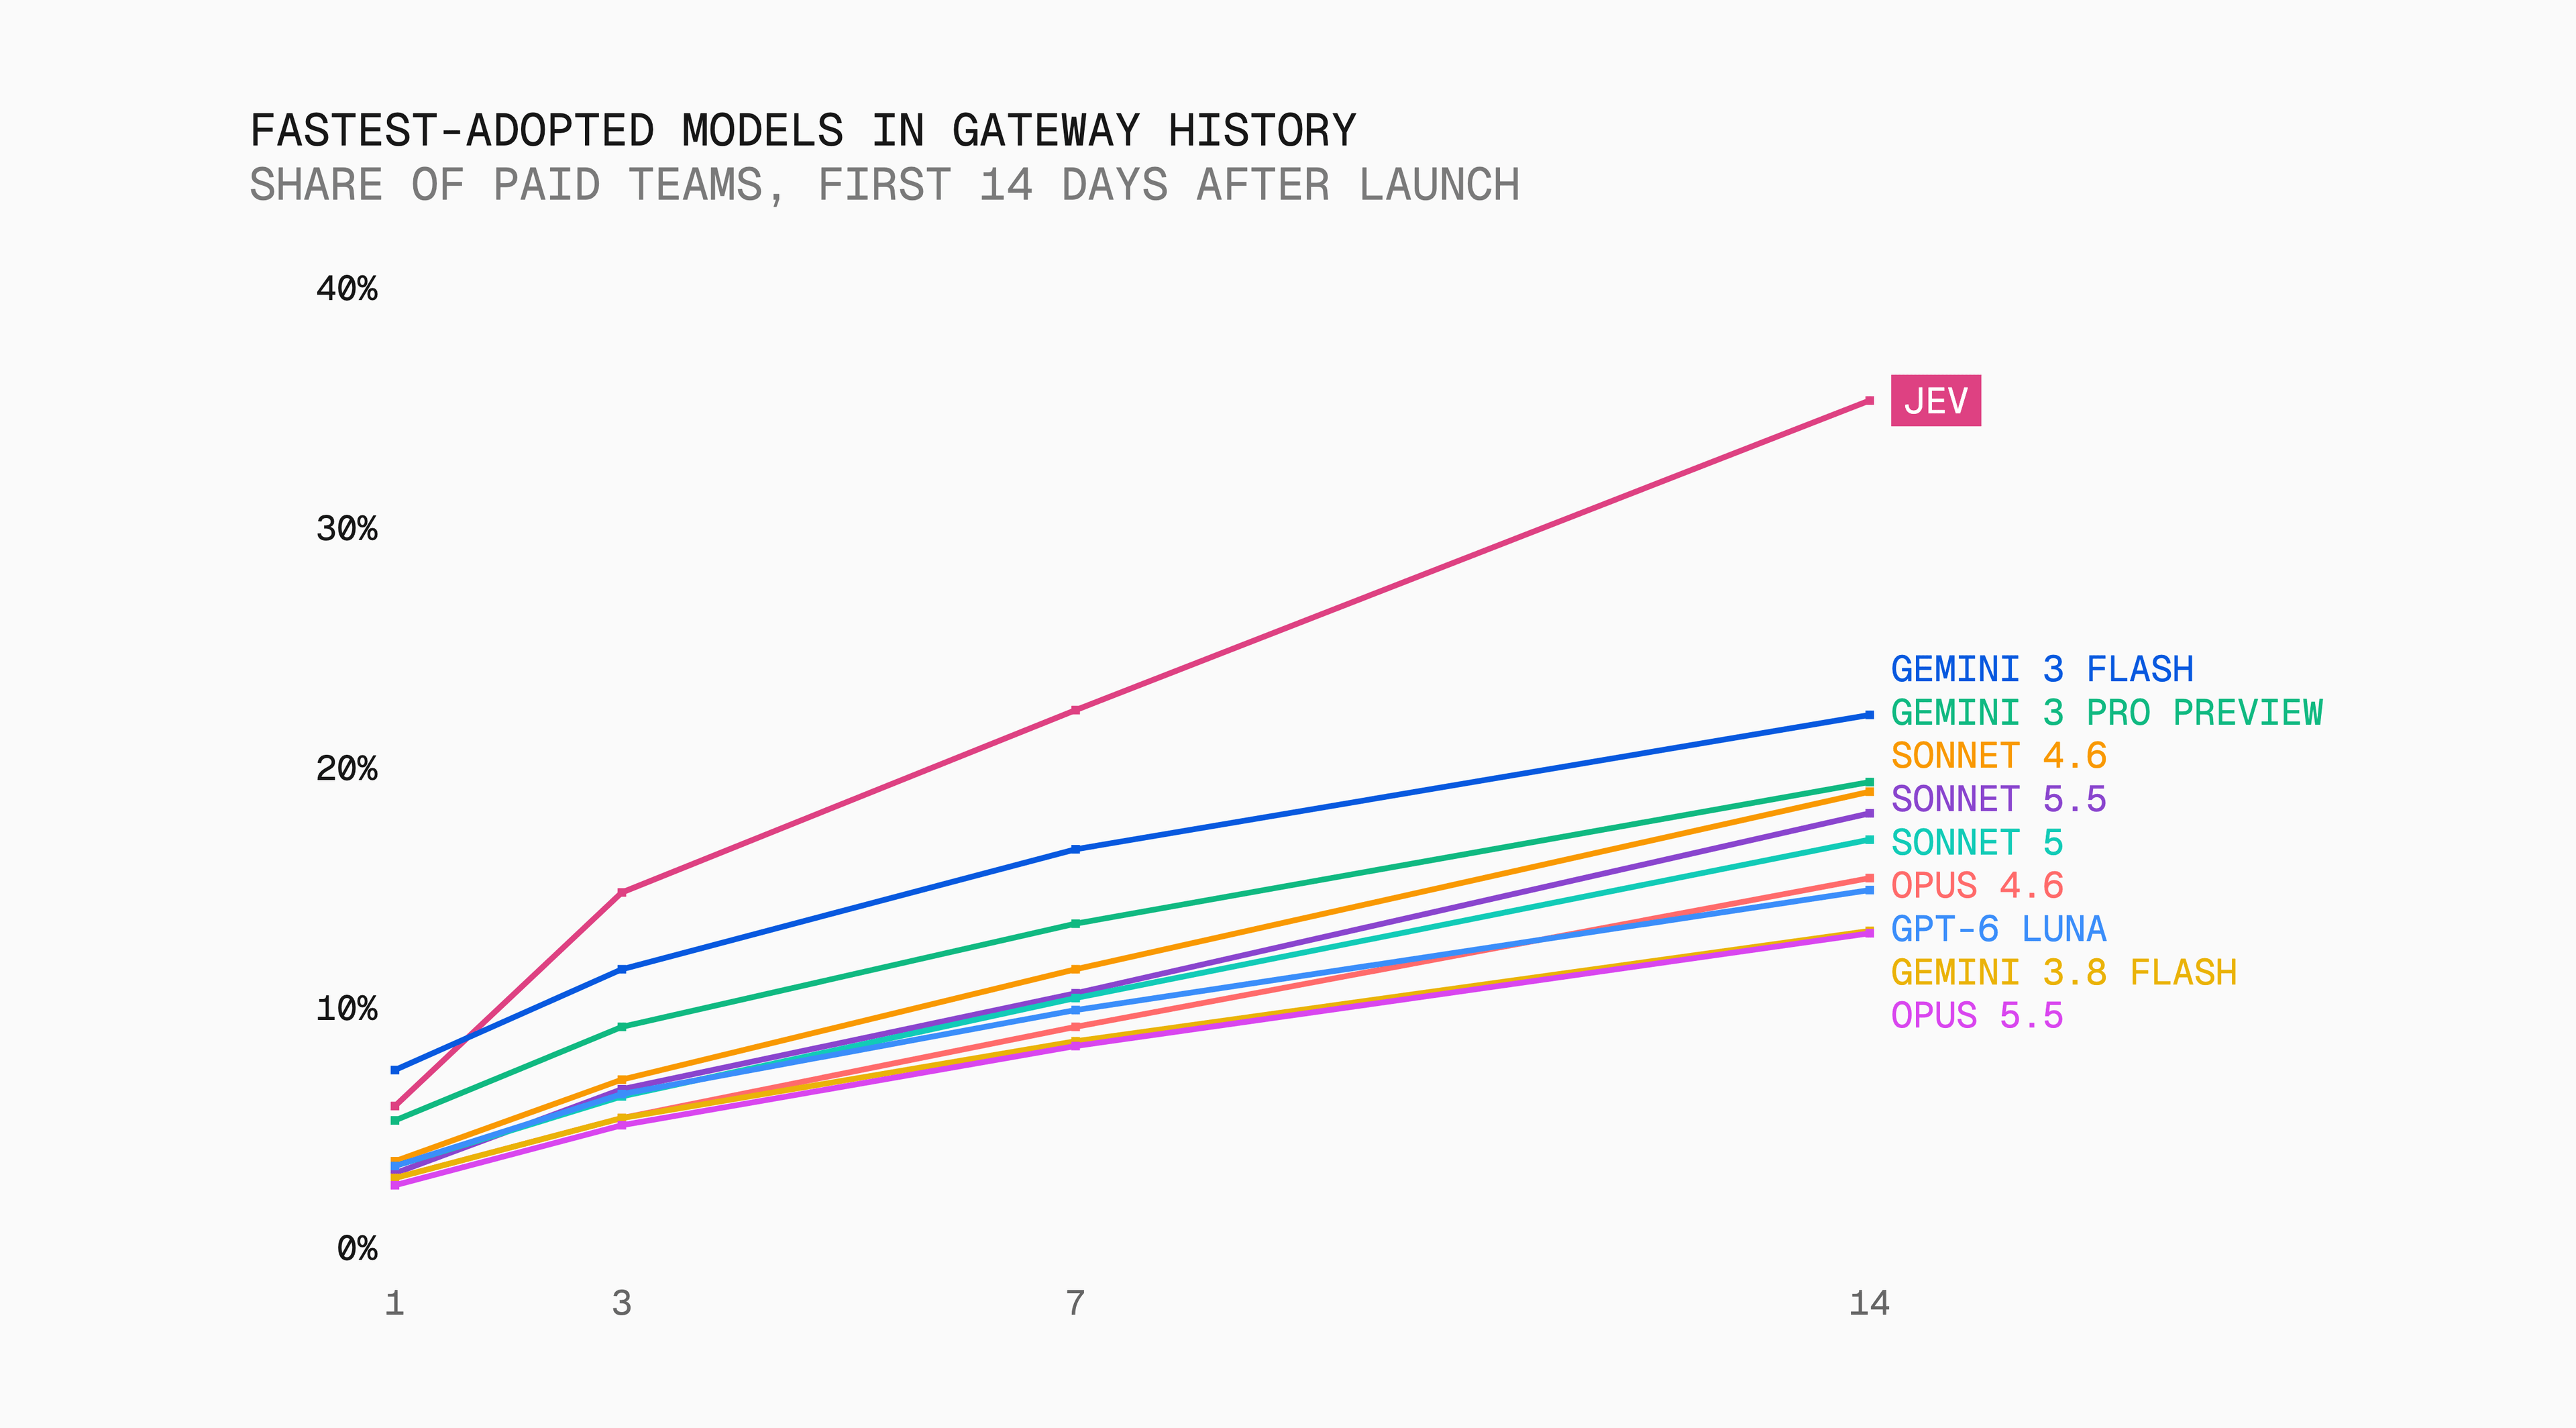
Jev also received the most requests of any model in September, even though it launched halfway through the month. Of the teams that tried Jev in week one, 55.6% returned in week two, the fifth-highest retention rate.
Jev is a decision model. Compared with typical language-model requests, a Jev request is faster, cheaper and uses a fraction of the tokens. So although its adoption was fast and broad, it accounted for just 1% of the month’s tokens and 0.15% of spend.
In September, Jev quickly became a popular model for production while remaining a tiny part of the inference bill.
Copy link to headingOpus 5.5 takes more than one in ten gateway dollars
The launch that received the most dollars was Opus 5.5, with more than twice the share of any other September launch, followed by GPT-6 Astra and DeepSeek-v4.1-Flash.
Opus 5.5 caught on quickly, with almost nine in ten dollars coming from teams already using Opus 5. Existing customers were trying the new release while the wider Opus family was losing market share.
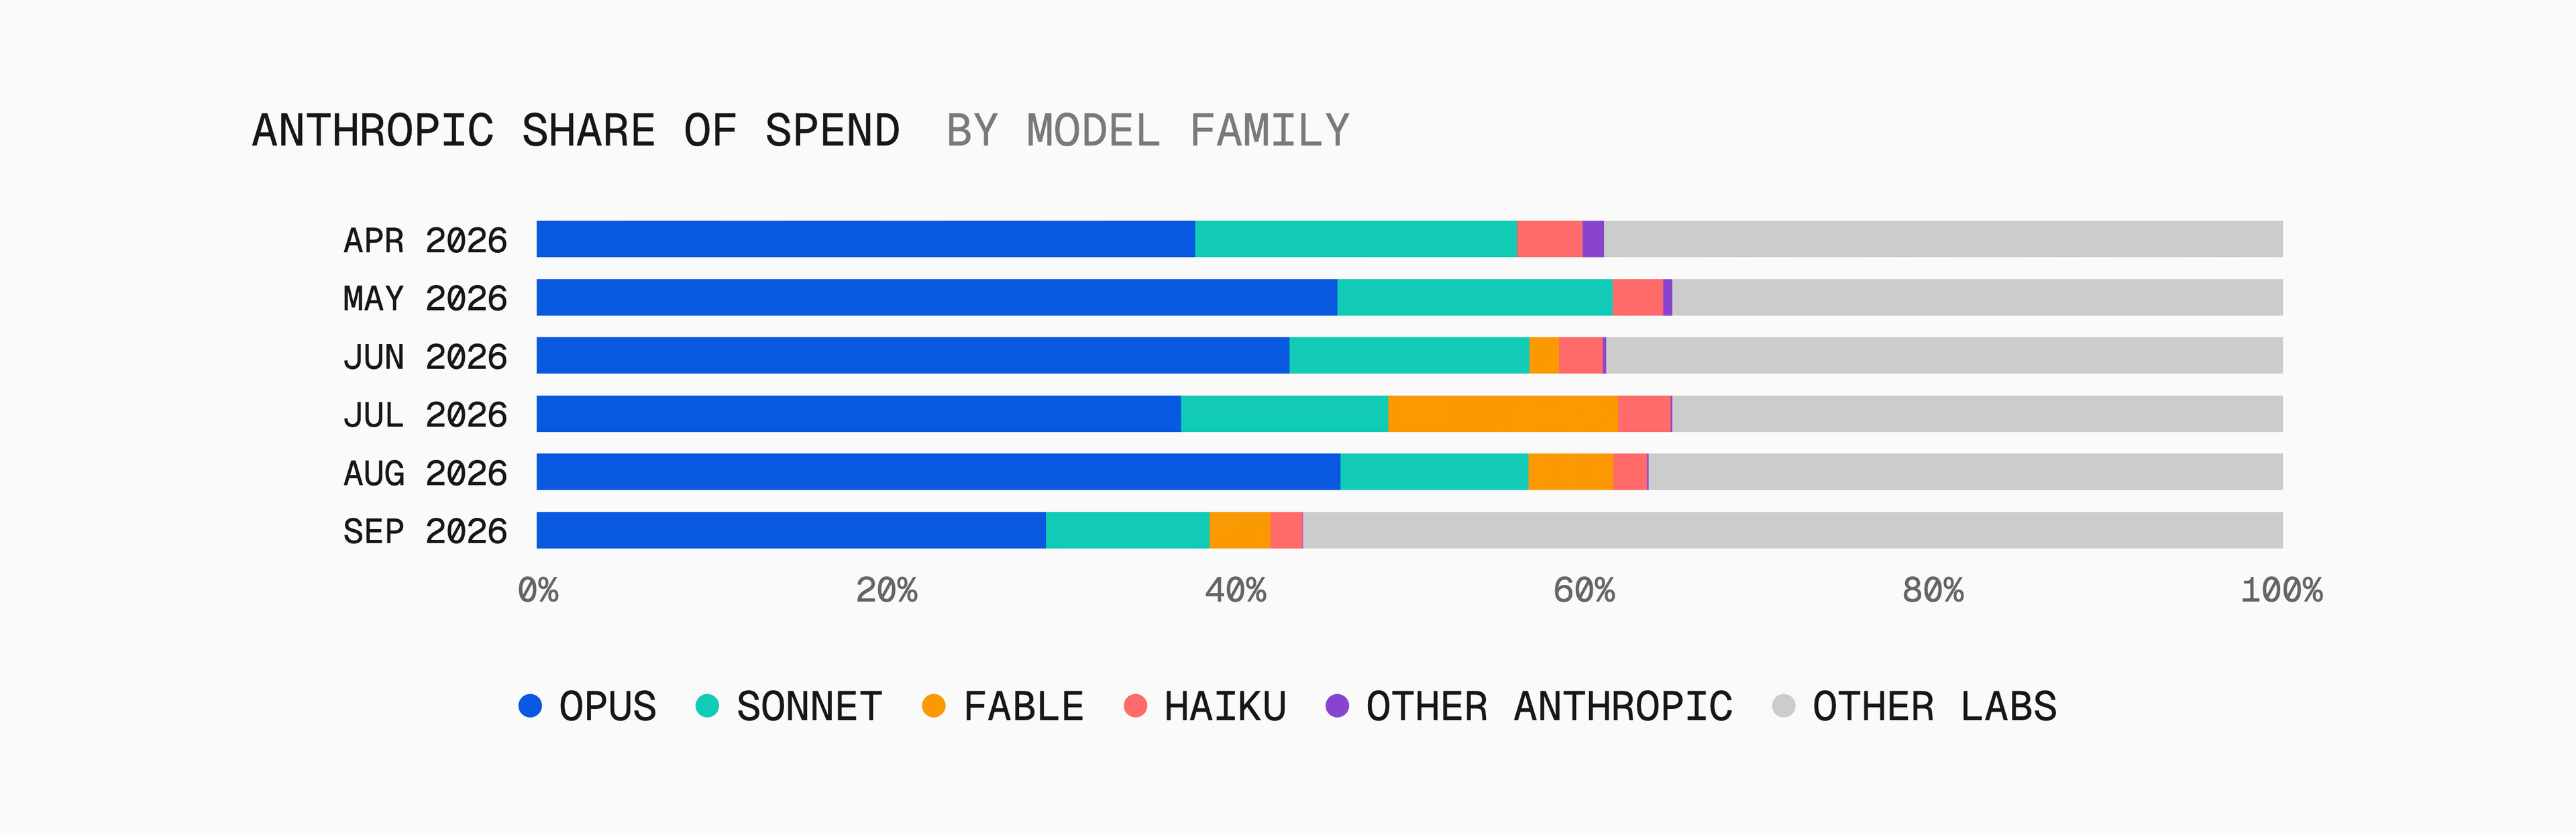
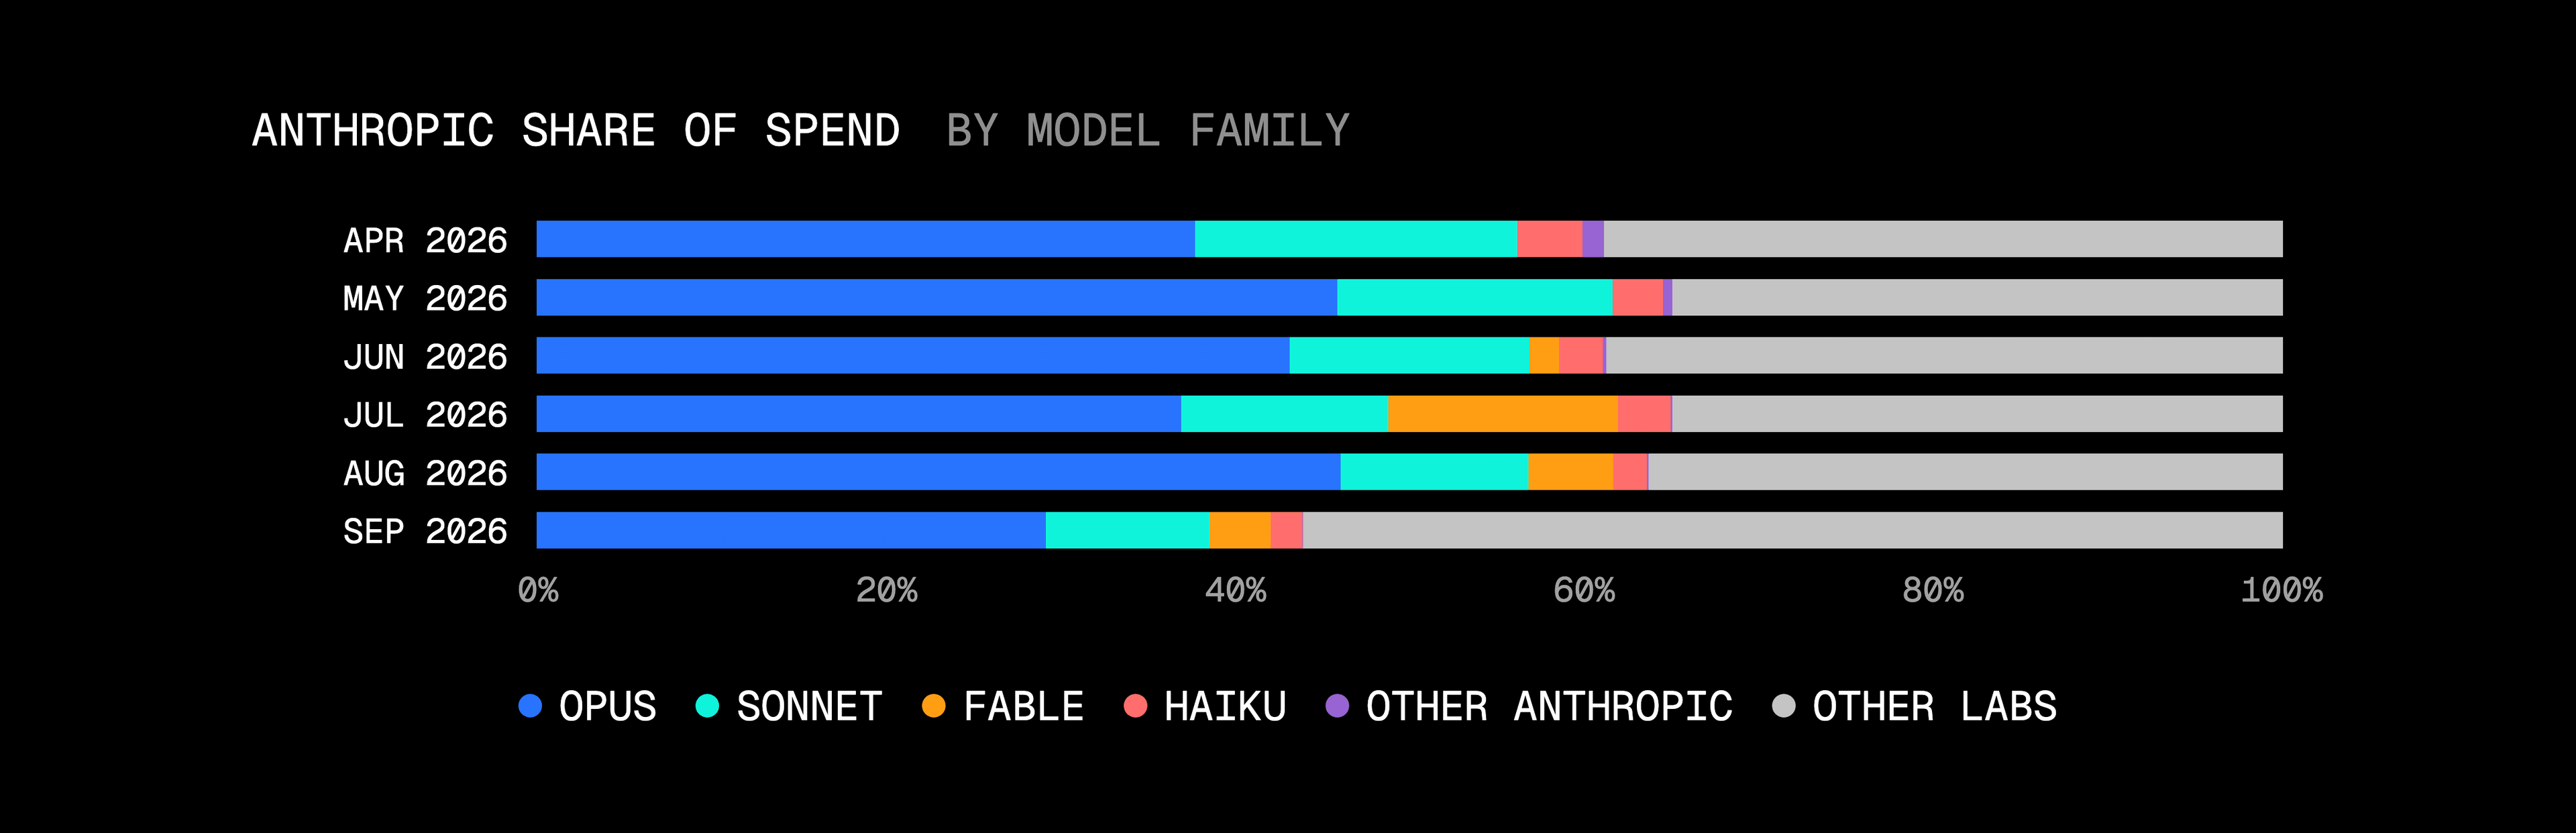
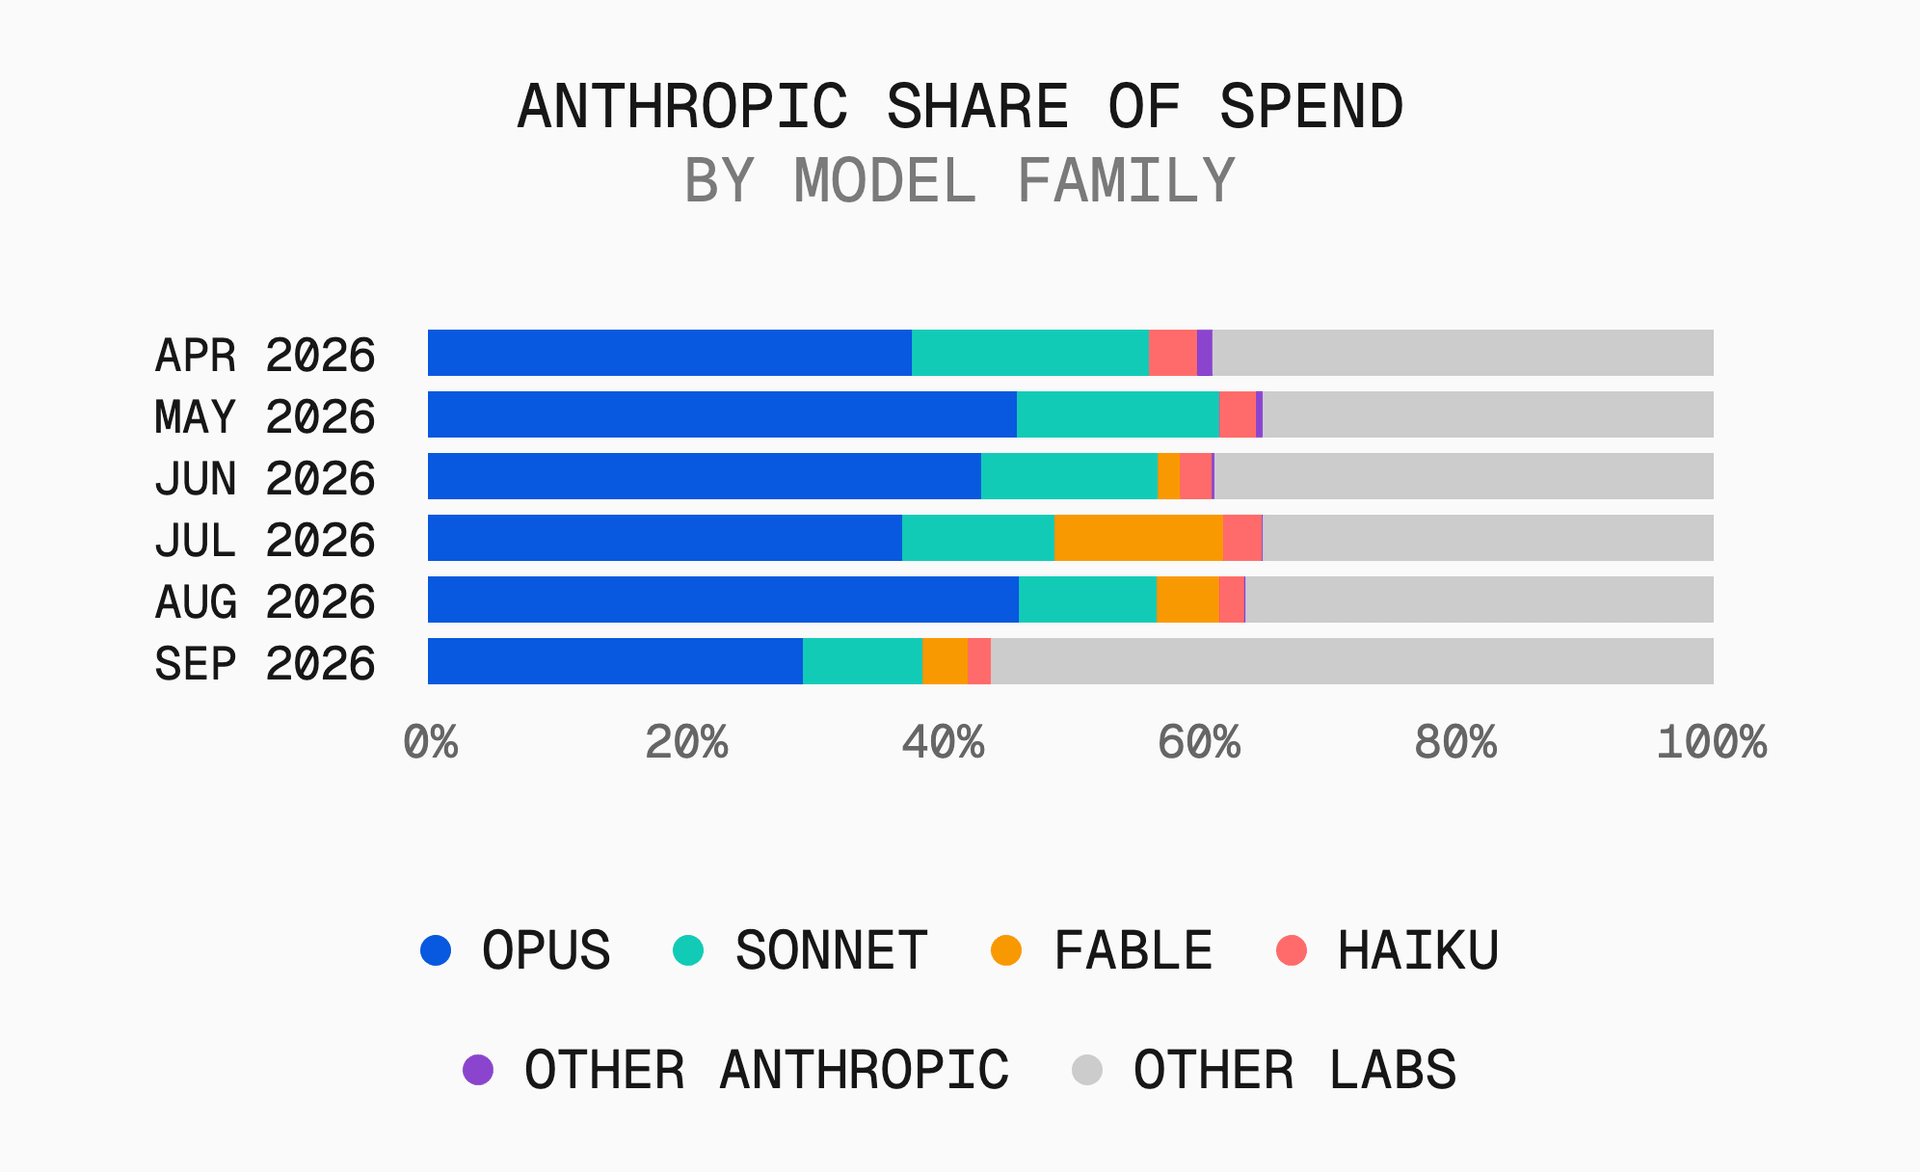
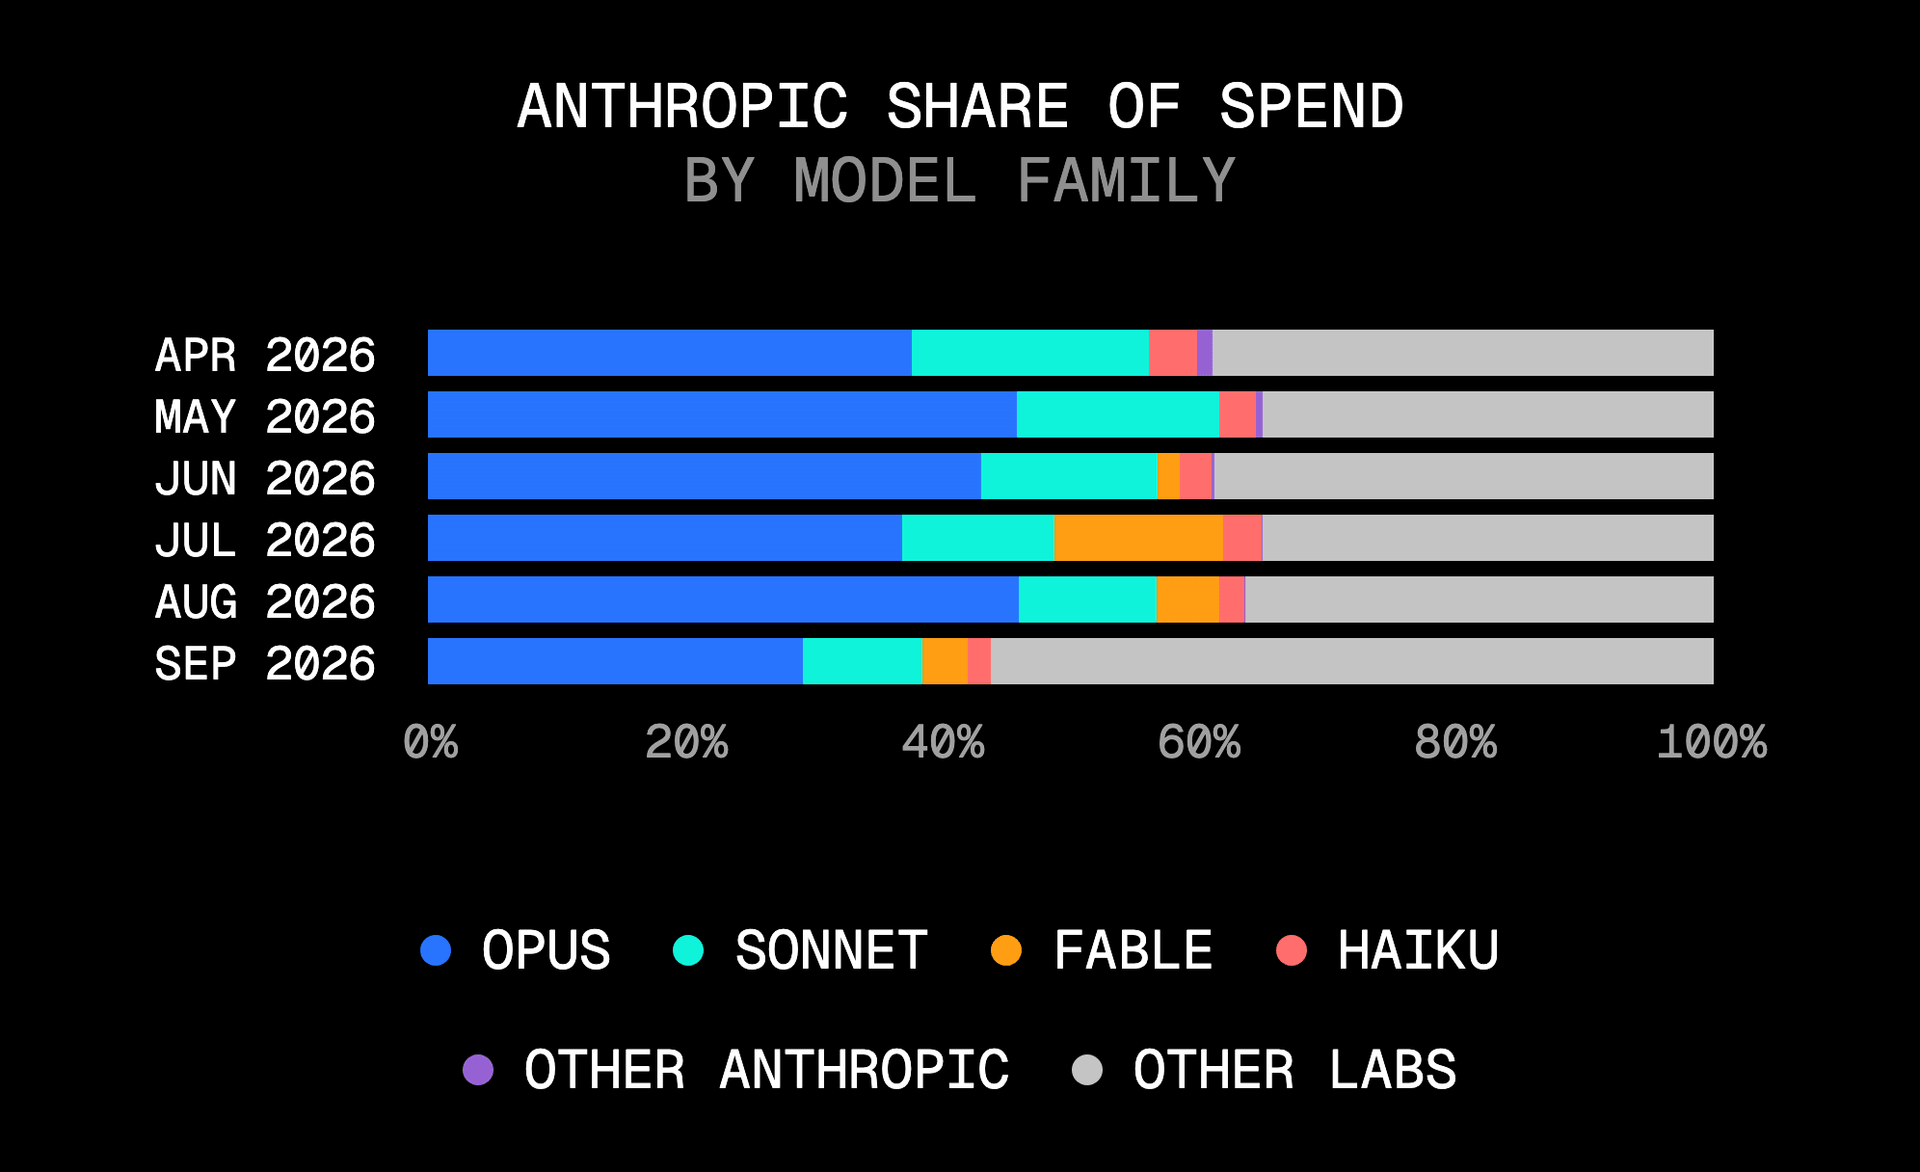
Across all versions, Opus accounted for almost a third of gateway dollars in September, down from one in two in August. Anthropic’s overall share fell below half of total gateway spend for the first time, dropping from 63.7% to 43.9%.
Copy link to headingLuna brought users back; Astra brought spend
GPT-6 Luna reached nearly three out of every twenty paid teams in its first two weeks, in third place behind Jev and Sonnet 5.5. But its return rate was the highest of the month; almost two-thirds of the teams that tried it in its first week came back in the second.
GPT-6 Astra reached a smaller audience but took more budget. In its first two weeks, it accounted for about one in twenty gateway dollars; Luna accounted for less than one in a hundred. Luna reached almost three times as many teams while Astra captured more than five times the share of spend.
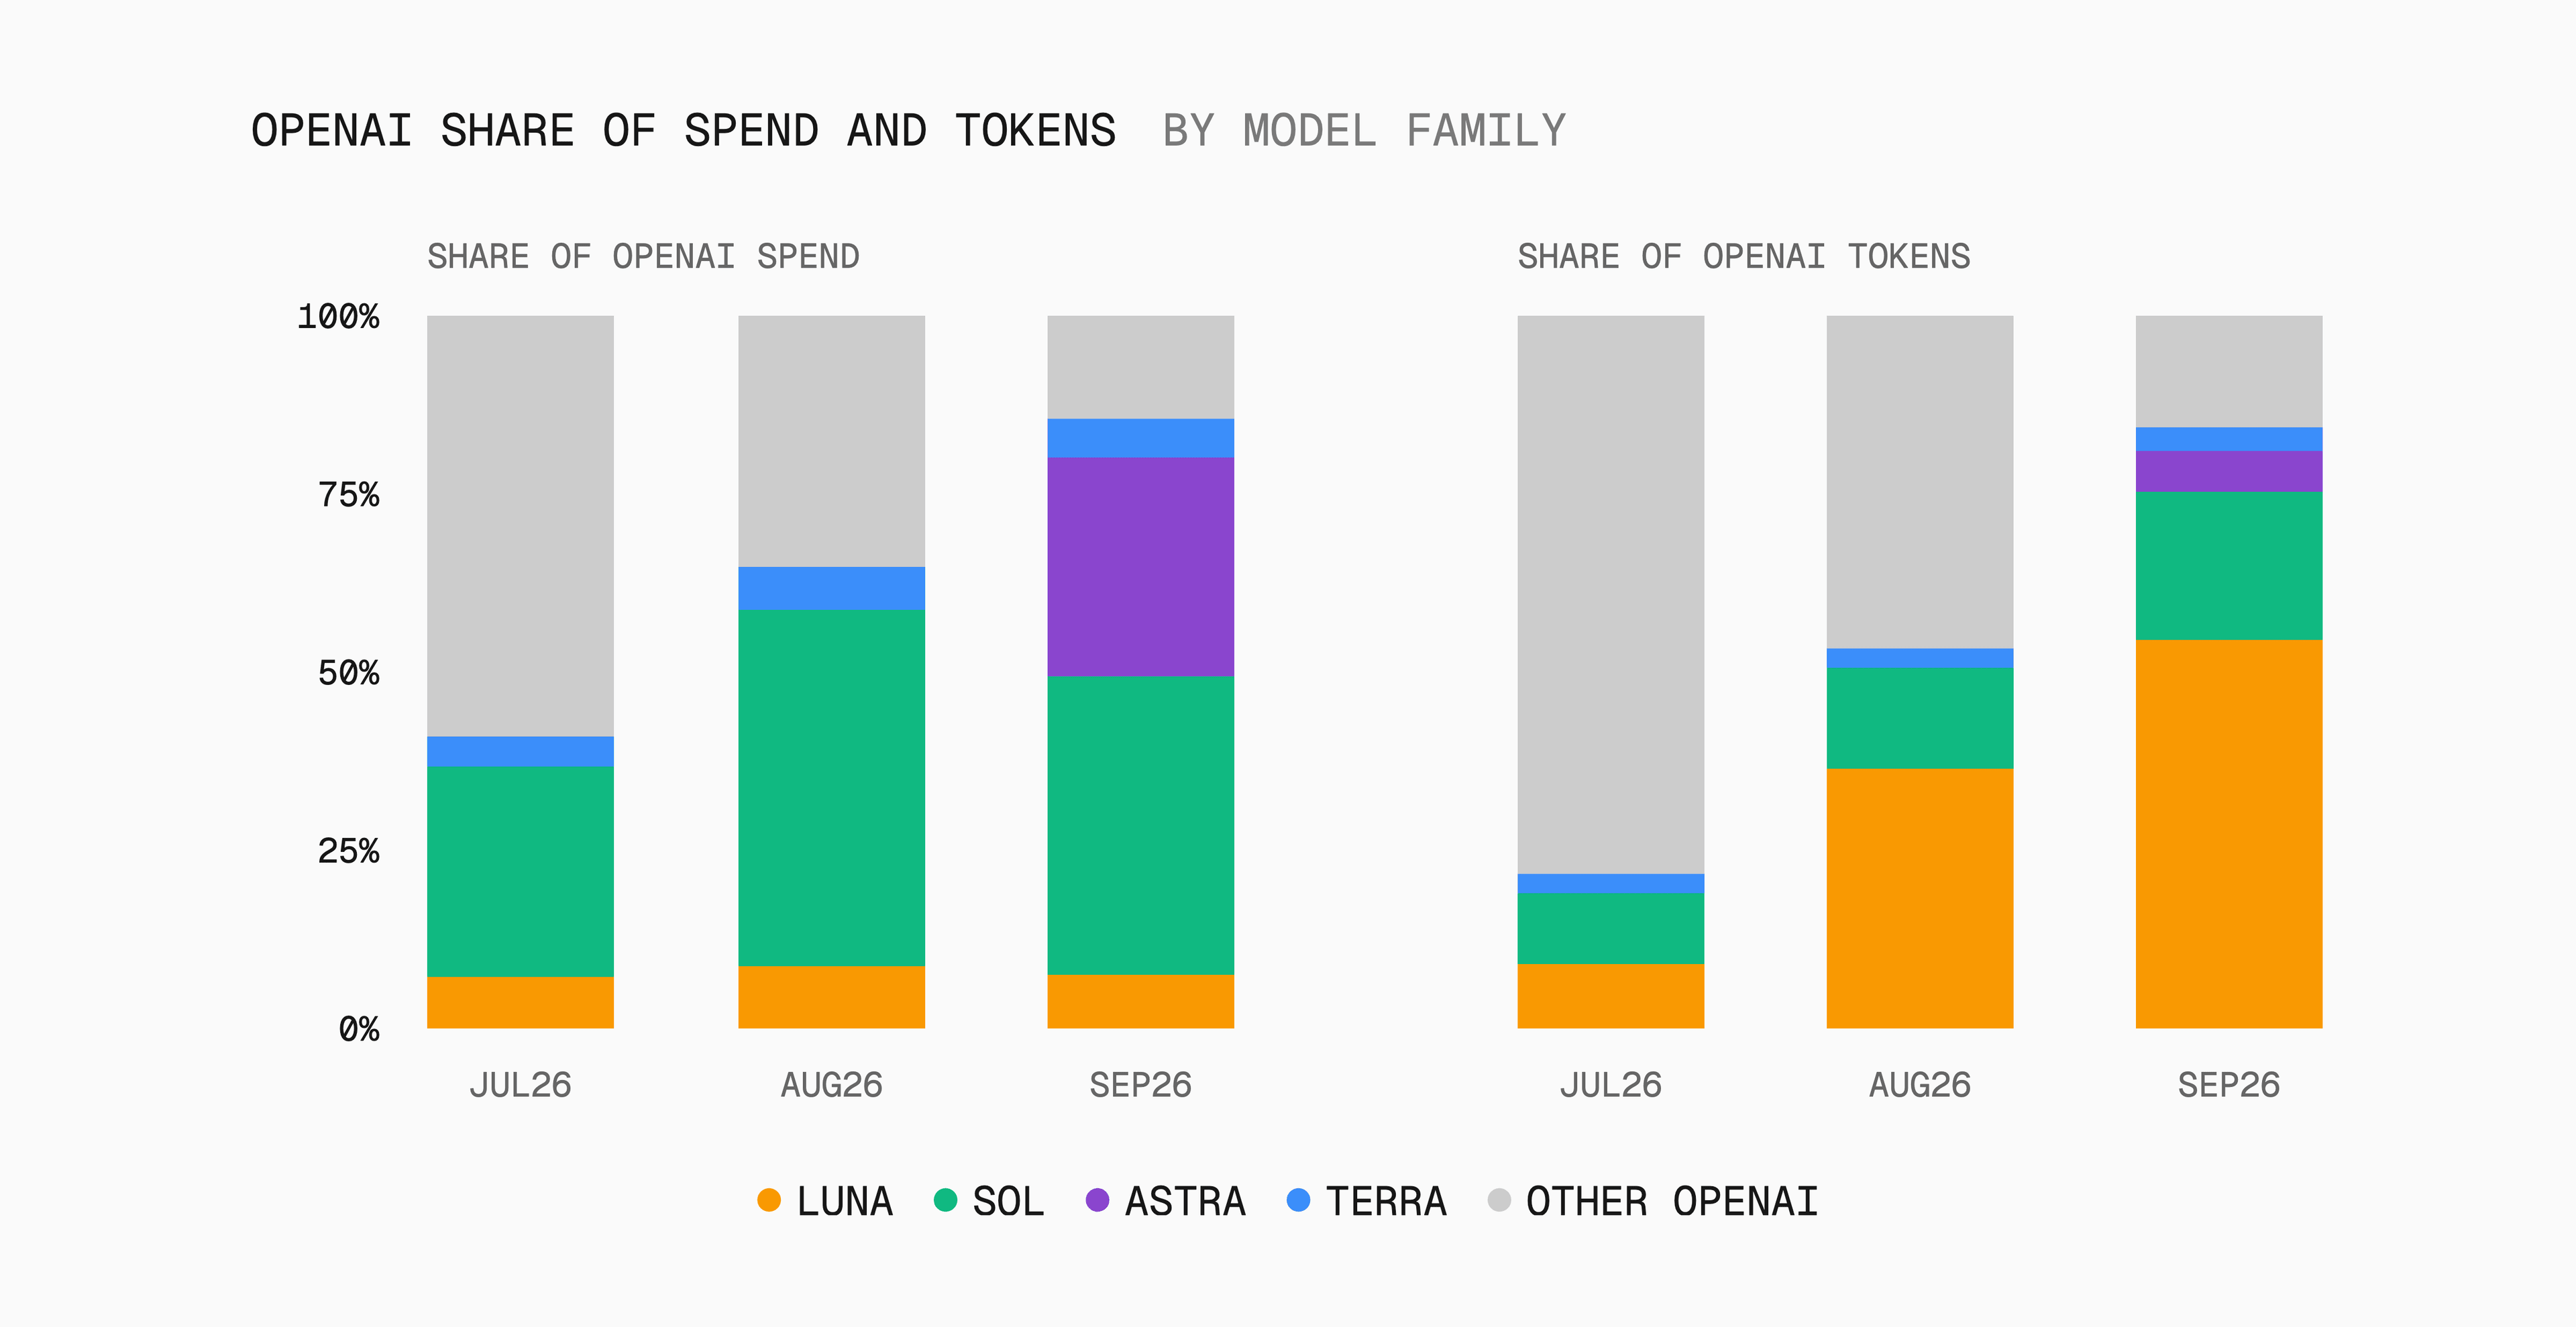
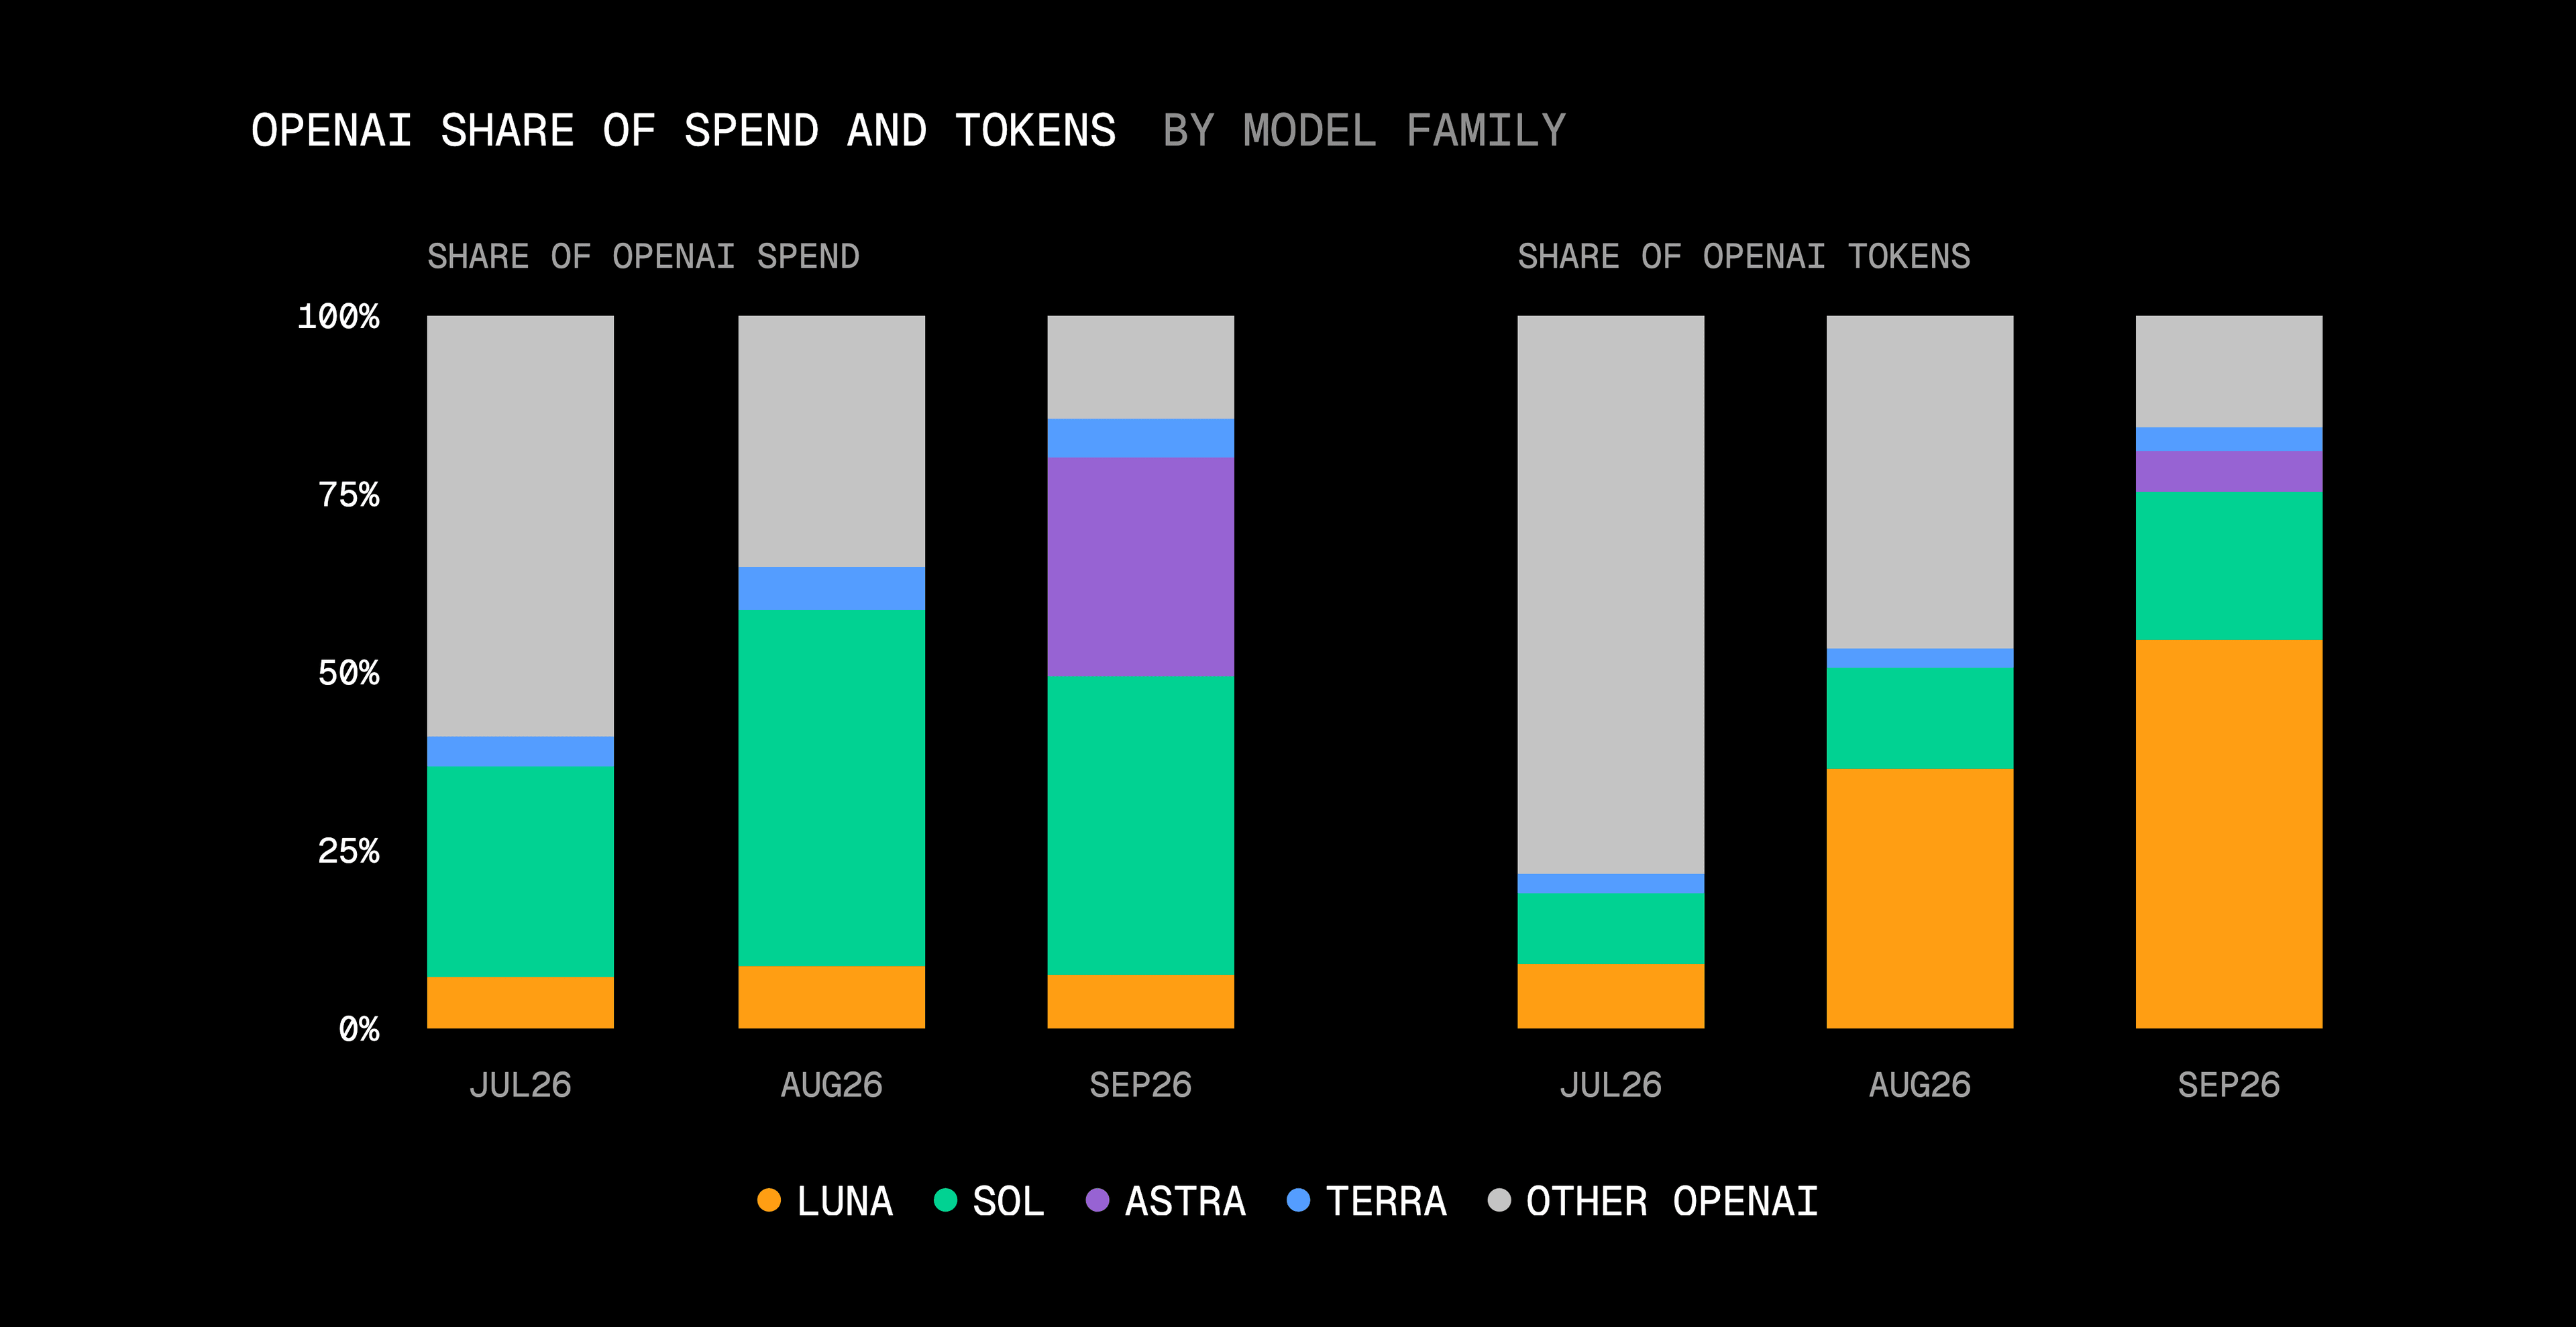
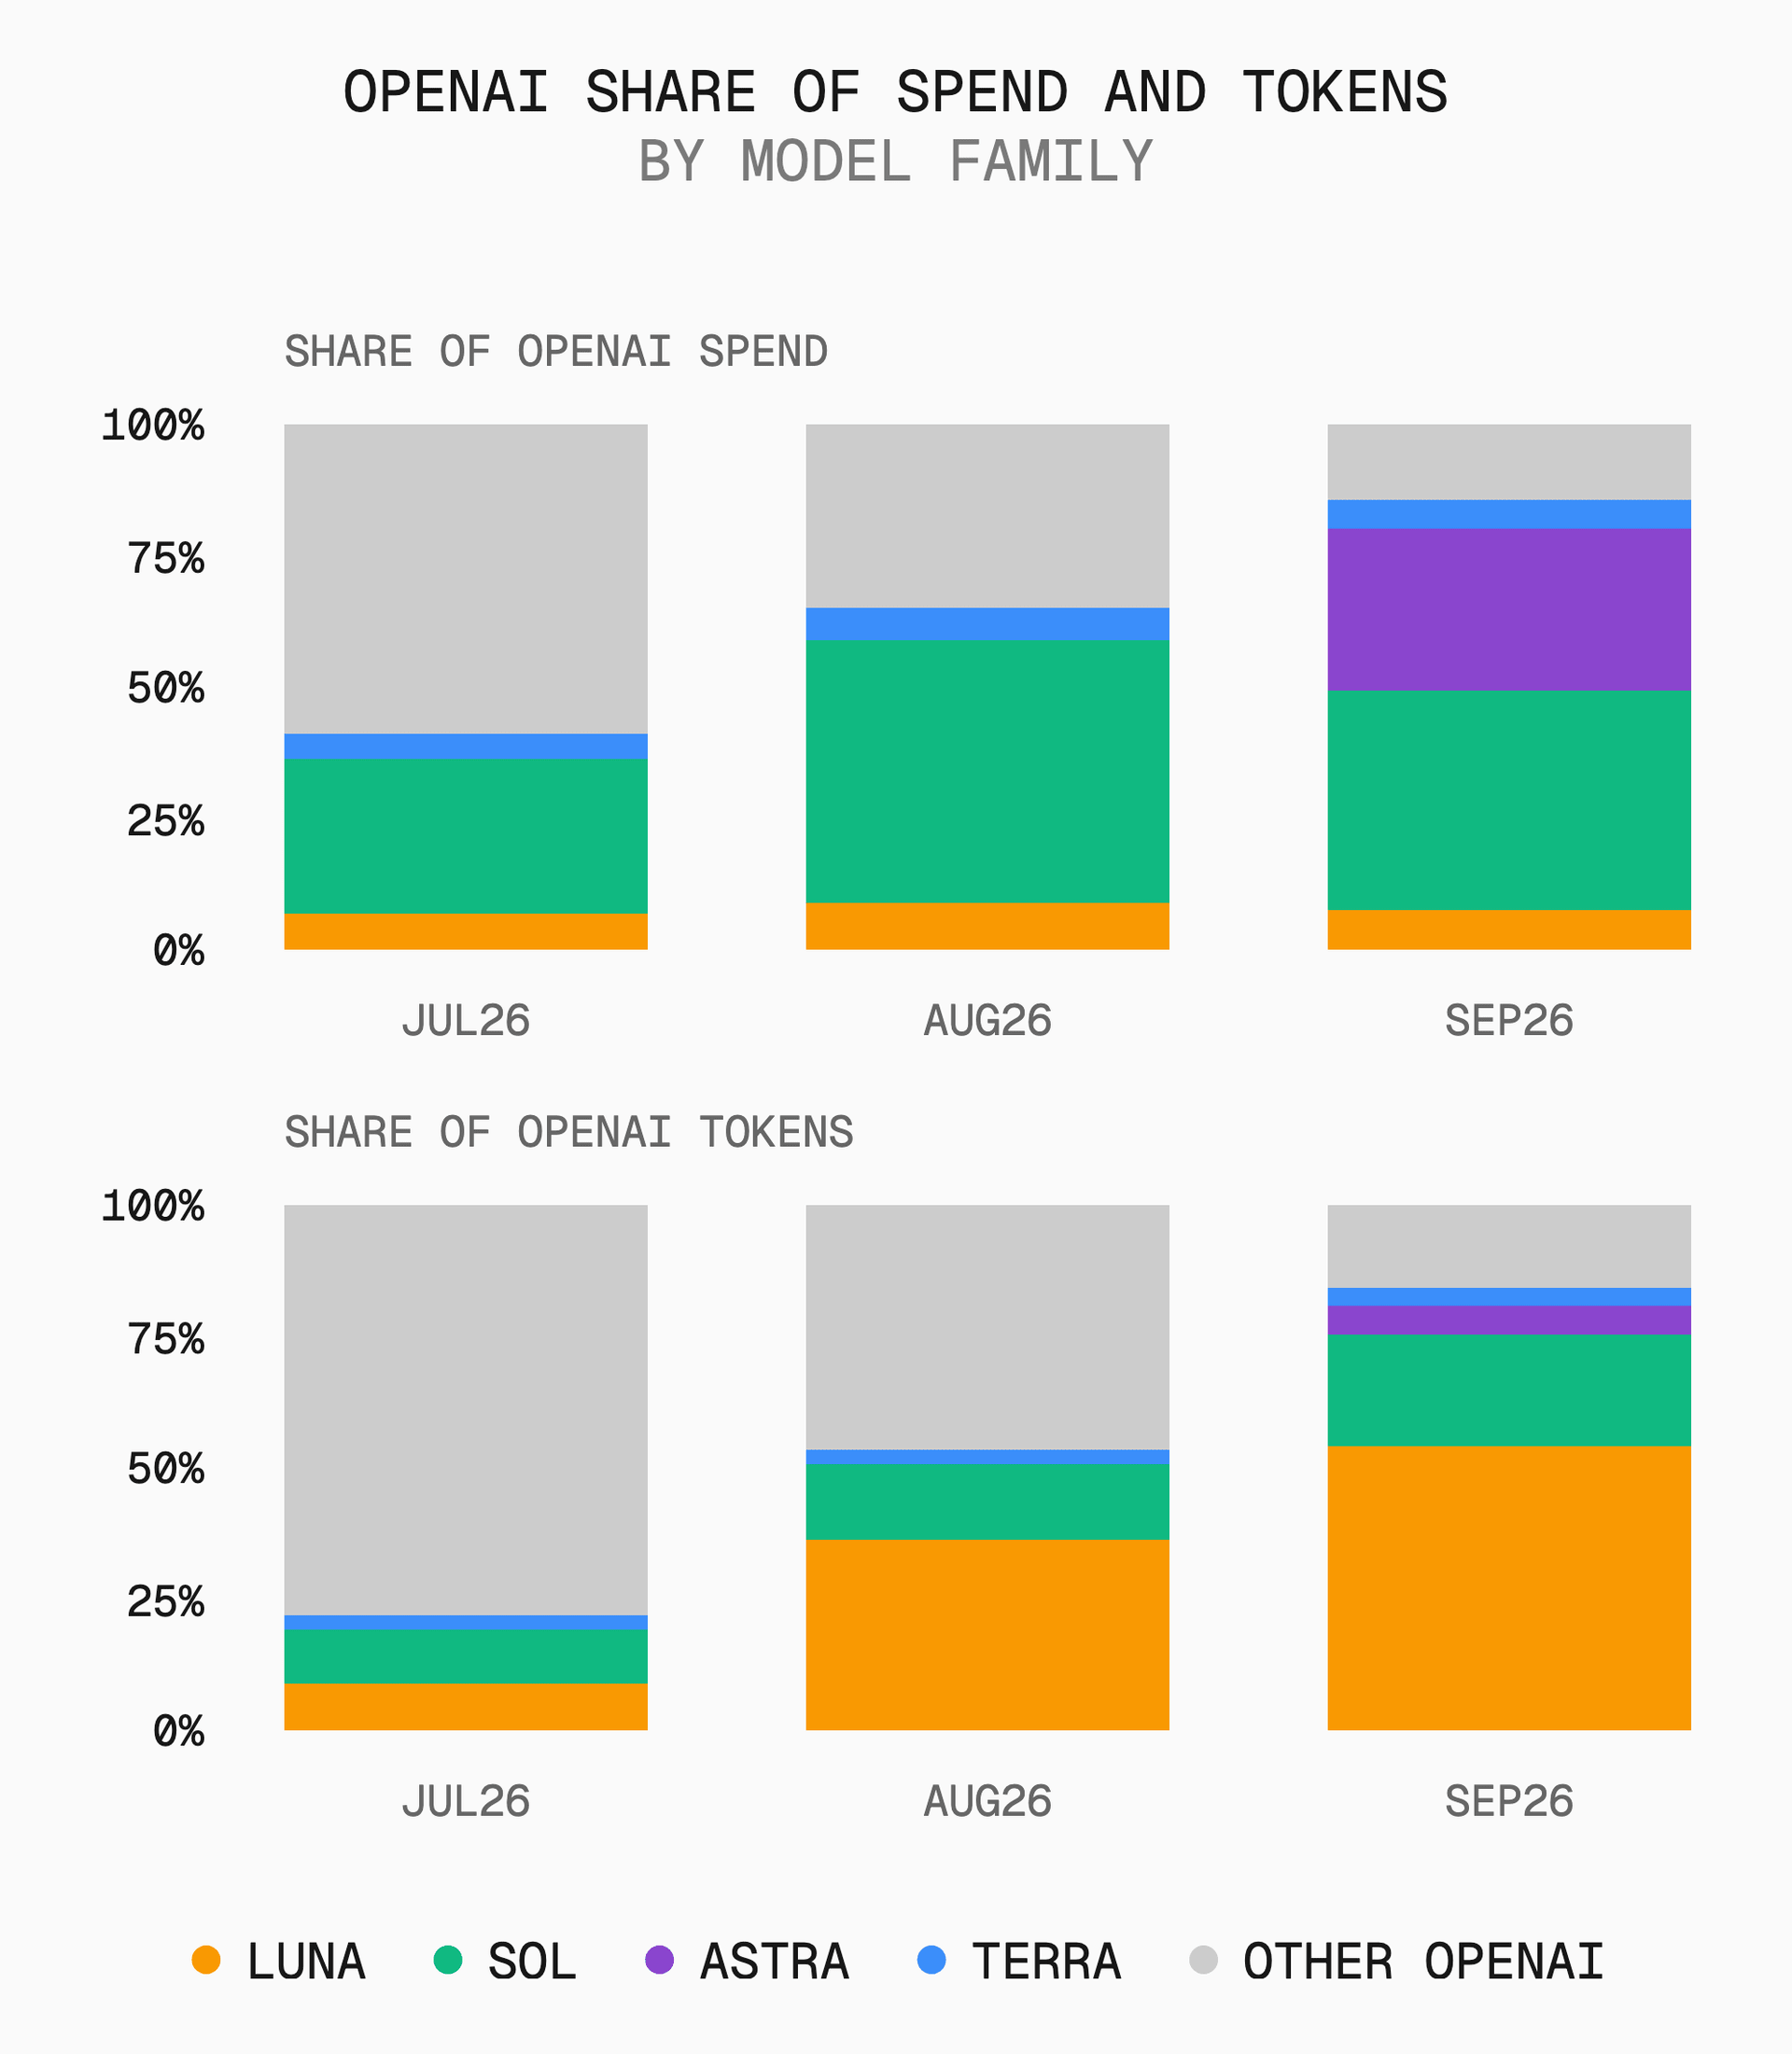
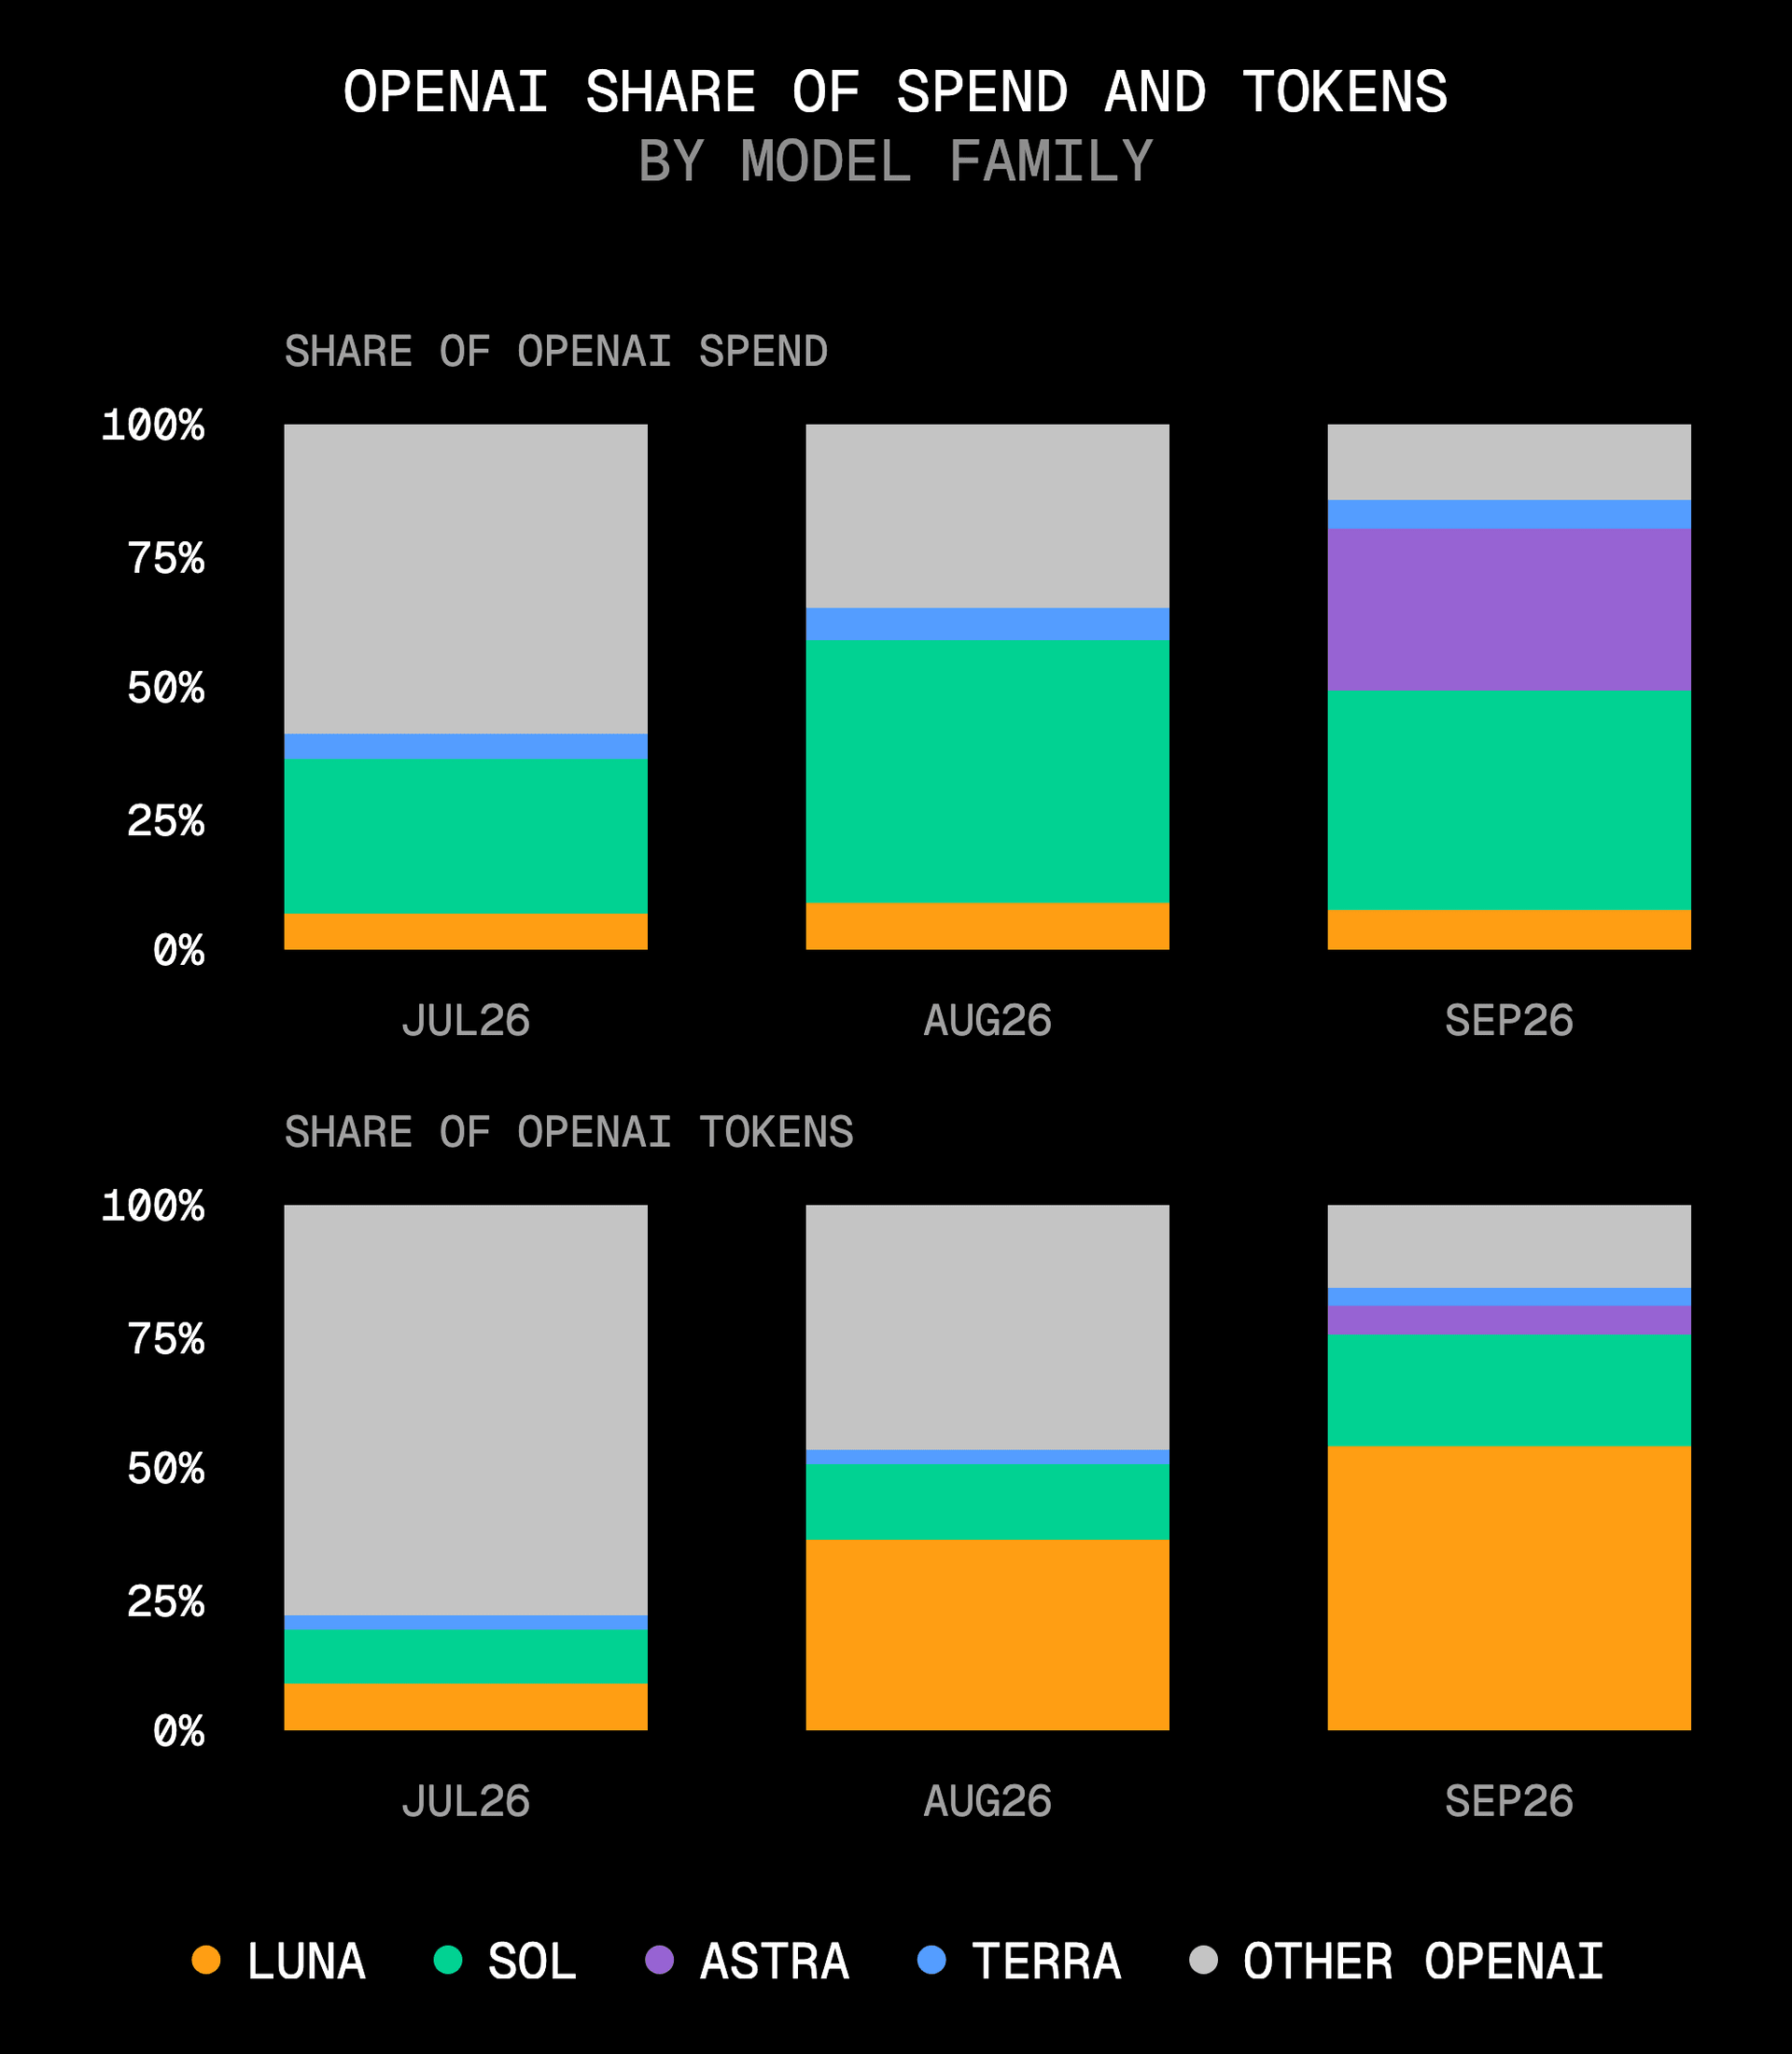
OpenAI is attracting more customers with Luna, but capturing far more money with Astra, even though fewer teams use it.
Copy link to headingFull September scorecard
Copy link to headingPrevious AI Gateway Production Index reports
Copy link to headingAbout this report
This report uses anonymized, aggregate traffic routed through Vercel AI Gateway through September 2026.
A few notes on measurement:
Token volume includes input, output, reasoning, cached-input and cache-creation tokens.
Spending is estimated at published list prices; actual bills may differ. Average price per token is estimated spending divided by token volume.
Open-weight classifications follow the current AI Gateway model list, a broader definition than in earlier reports.
Switching rates compare paid teams with at least 10 million paid tokens in both months. “Most-used” is measured by paid tokens.
Provider location means company headquarters.
Launch metrics cover external paid teams during each model’s first 14 days. Reach uses paid teams active from the start of the launch month through the data cutoff. Spend share uses total paid gateway spending during the model’s window. Return rate is the share of first-week teams that used it again in week two.
Model counts cover December–September, with each version counted separately. Team-size thresholds use total input and output tokens over that period.
All figures use the most recent data and protocol available; prior months may be revised as methodology is updated.
Read more about our methodology, and explore or download the public data.

