Speed Insights Overview
This page lists out and explains all the performance metrics provided by Vercel's Speed Insights feature.Vercel Speed Insights provides you with a detailed view of your website's performance metrics, facilitating informed decisions for its optimization. For granular visitor data, turn to our Web Analytics.
By enabling Speed Insights, you gain access to the Speed Insights dashboard, which offers in-depth information about scores and individual metrics without the need for code modifications or leaving the dashboard. It's the key to analyzing your site's performance parameters without the hassle of introducing new scripts or headers.
When you enable Speed Insights, data will be tracked on all deployed environments, including preview and production deployments.
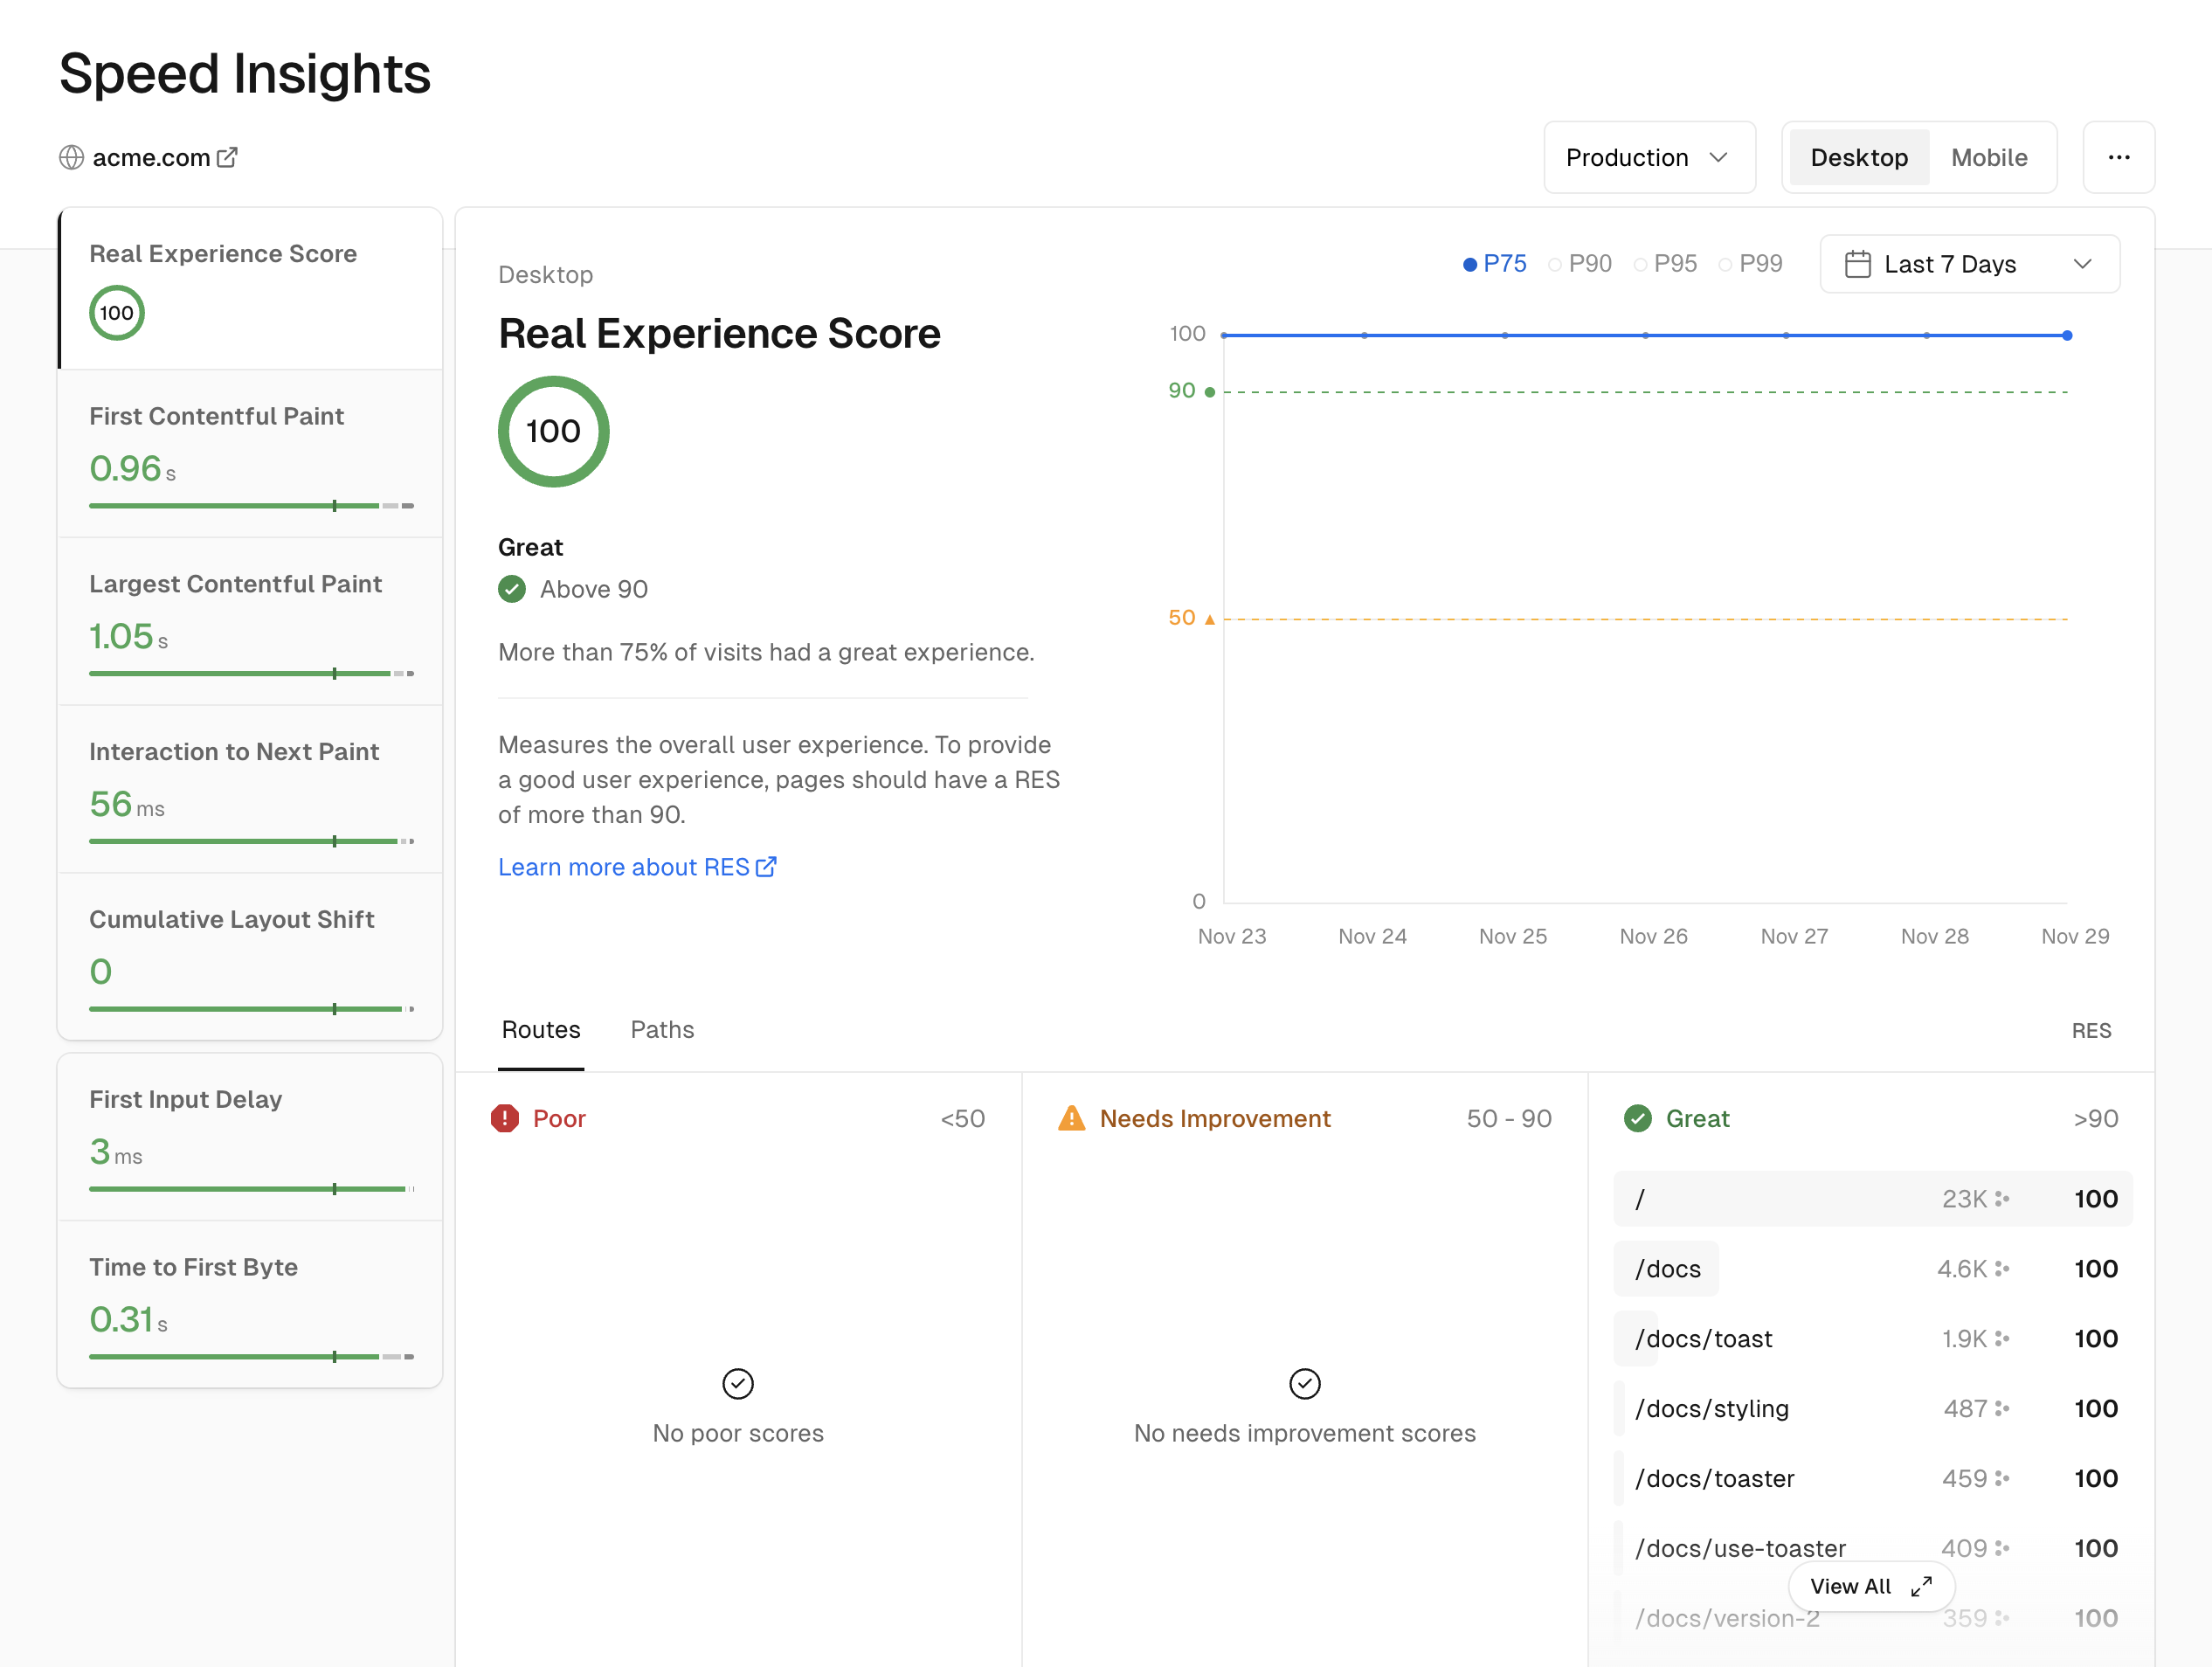
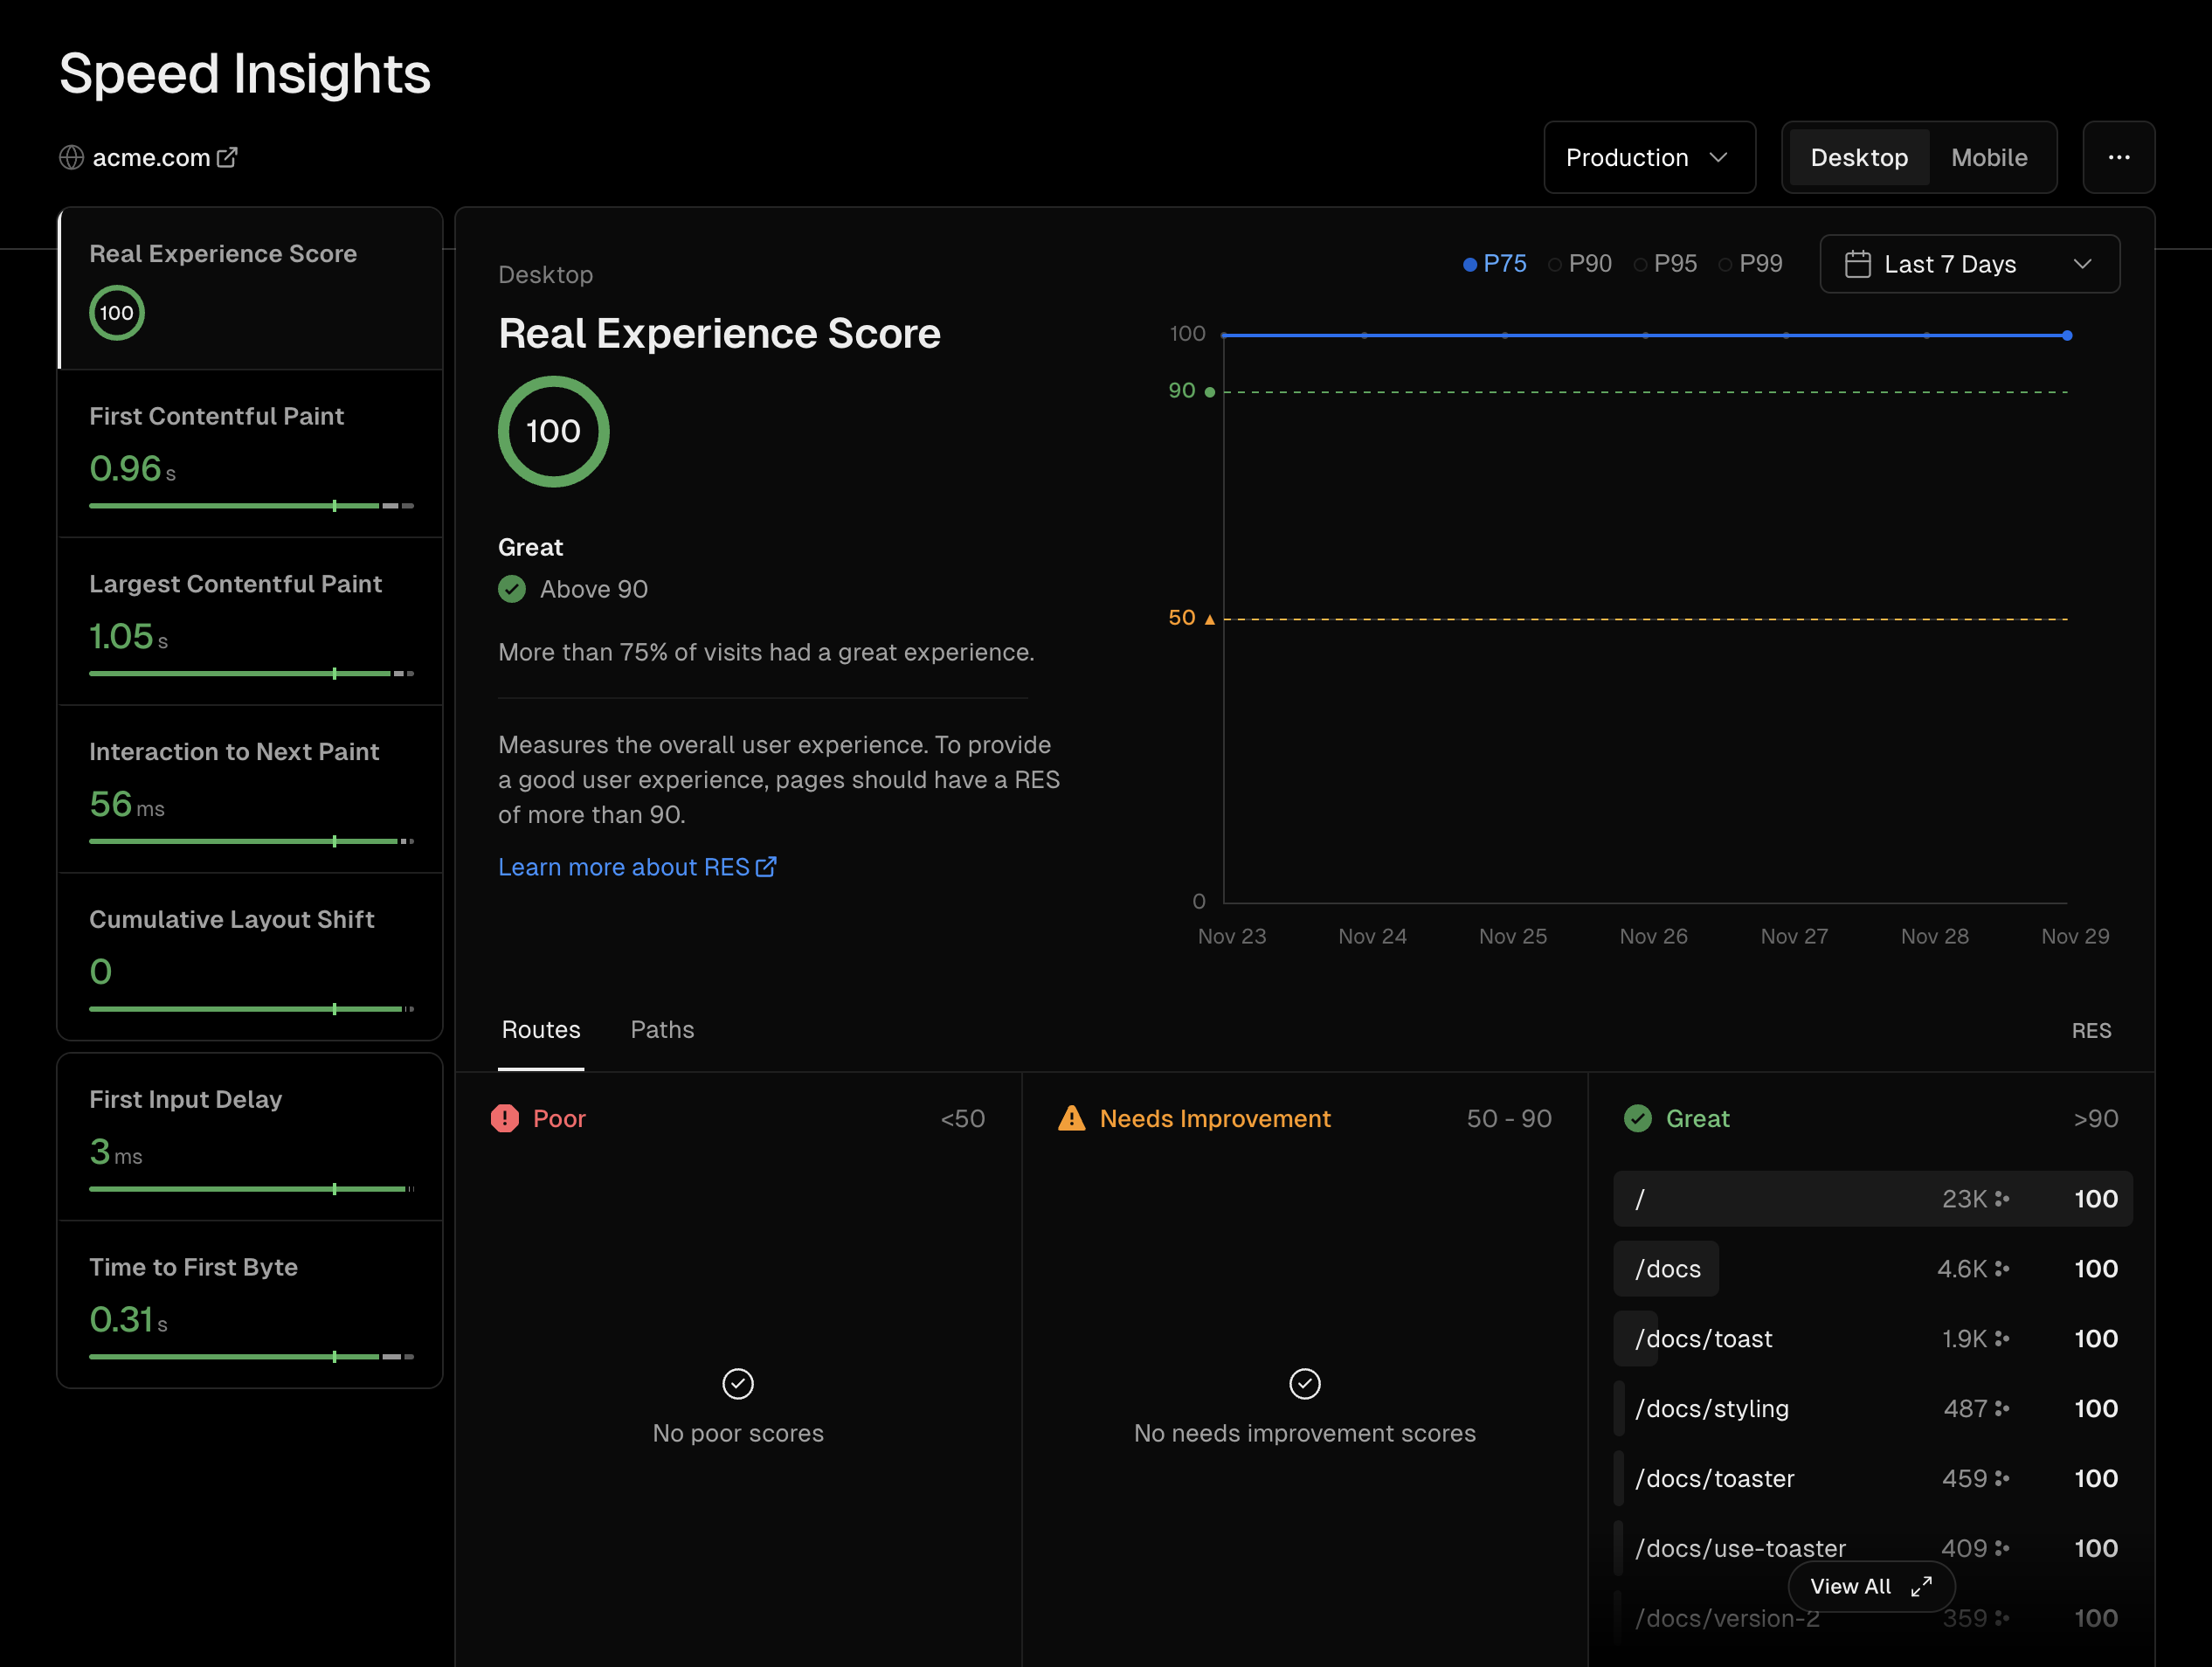
Once enabled, you'll see an interface where gathered data can be sorted and inspected based on a variety of parameters:
- Device type: switching between mobile and desktop
- Environment: filtering by preview and/or production environments
- Time range: varying from the last day up to the last 12 months (duration varies depending on the account type)
- Performance metric: switching between parameters that include Real Experience Score (RES), First Contentful Paint (FCP) and Largest Contentful Paint (LCP)
- Performance metric views: displaying the P75 percentile of data for the selected metric data points and time range in multiple views:
- Time-based line graph showing P75 by default. You can include P90, P95 and P99 in this view only
- Kanban board showing which routes or paths need improvement (URLs that make up less than 0.5% of visits are not shown by default)
- Geographical map showing the experience metric by country
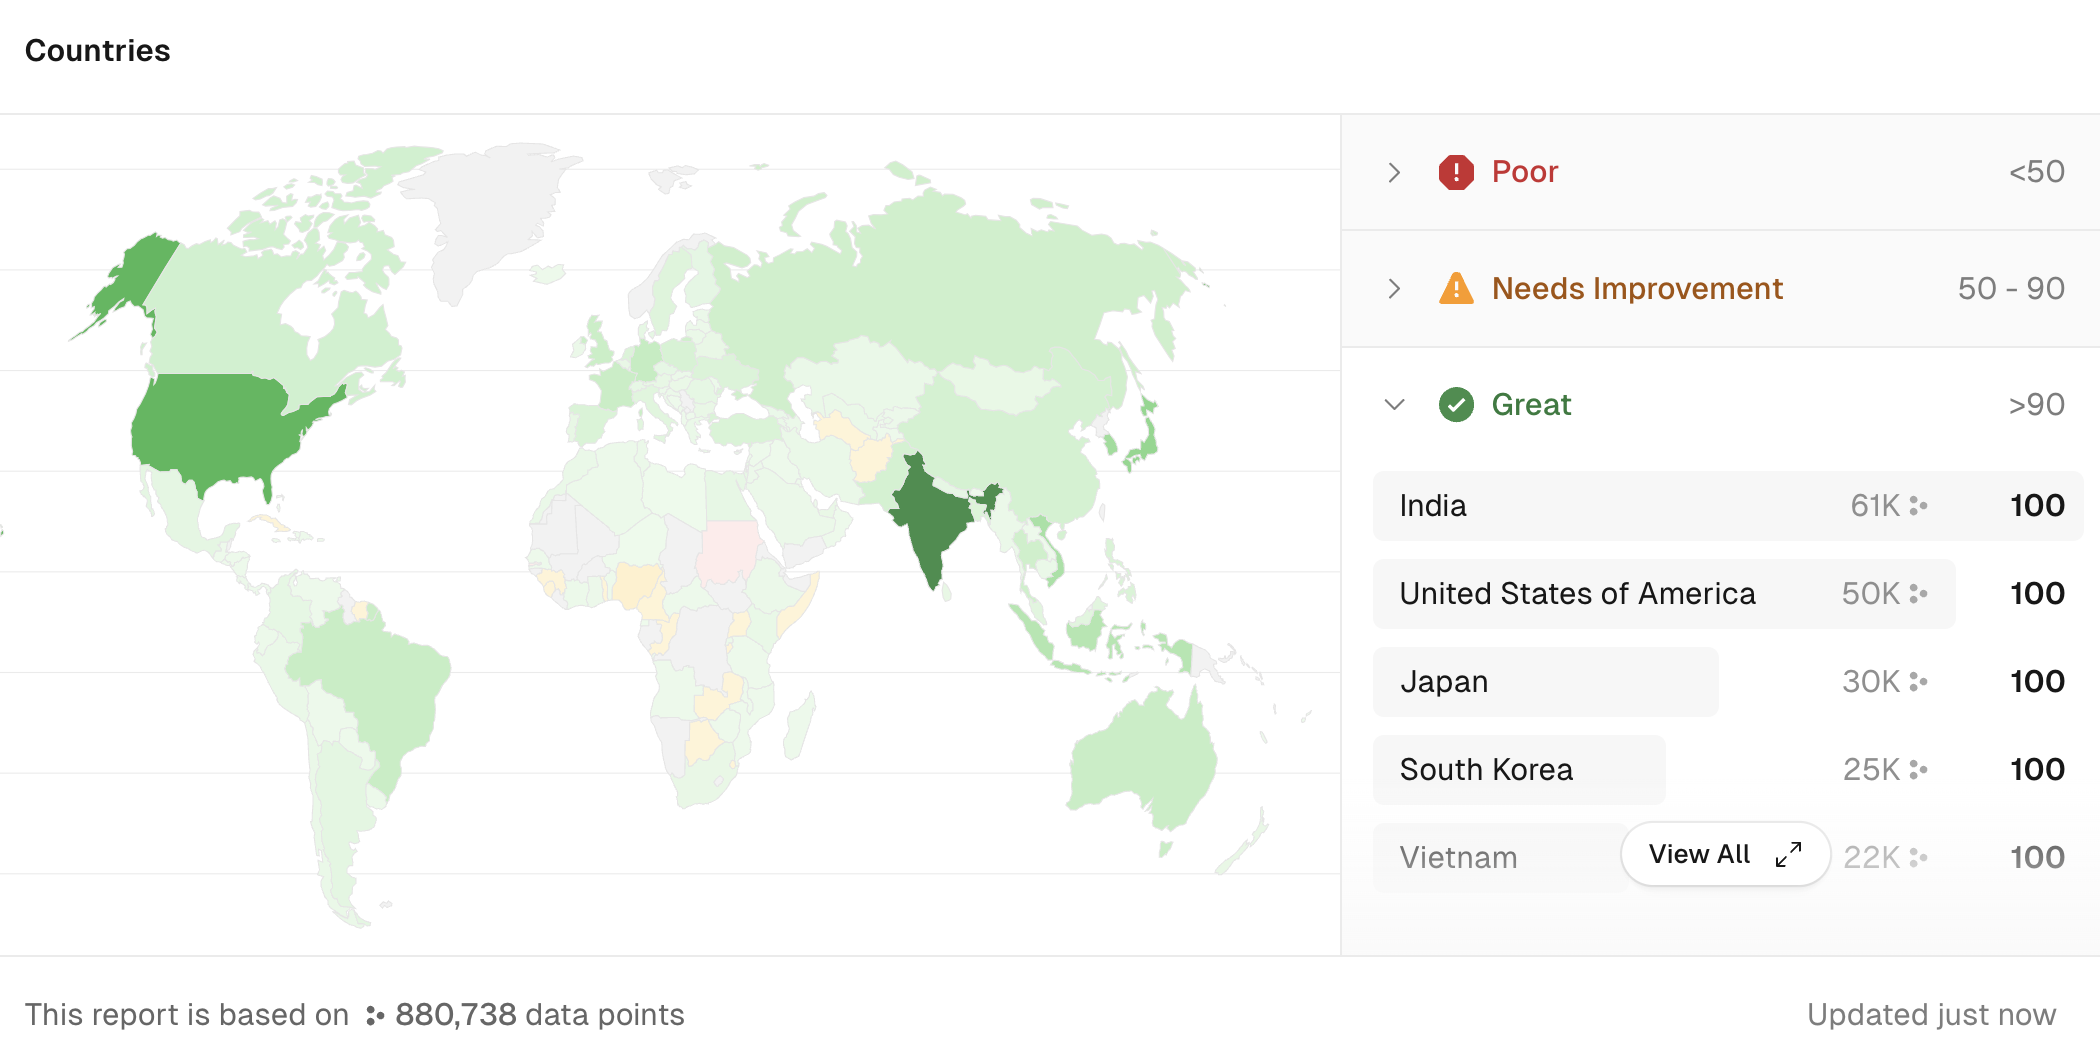
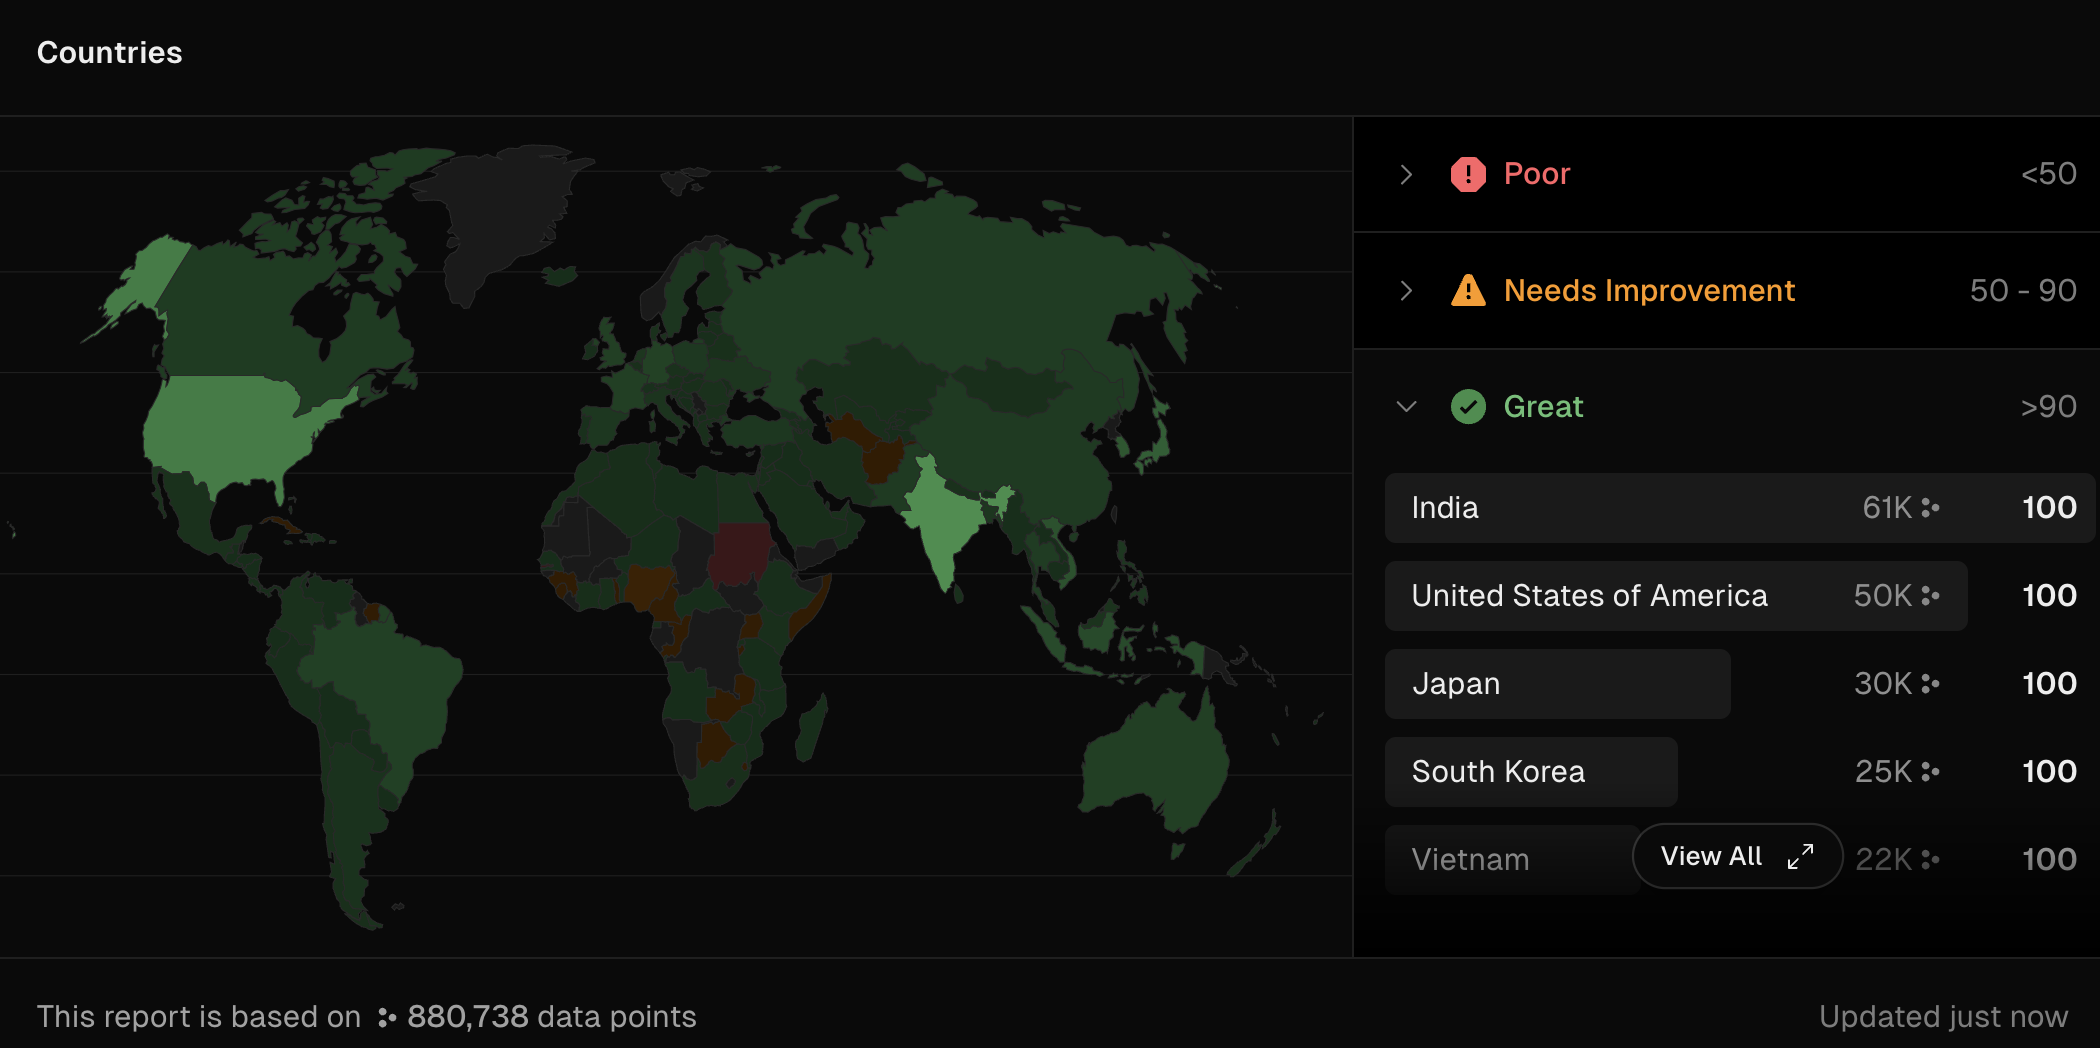
The data in the Kanban and map views is selectable so that you can filter by country, route and path. The red, orange and green colors in the map view indicate the P75 score.
Was this helpful?